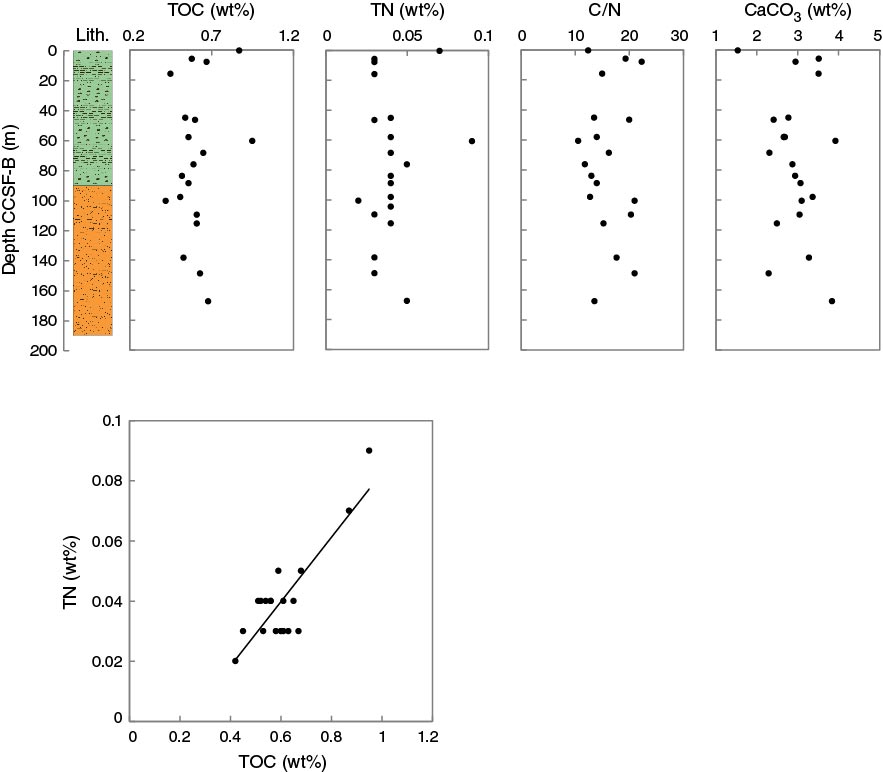
Figure F57. Solid-phase chemical concentrations, Hole U1419A. On the total nitrogen (TN) vs. total organic carbon (TOC) plot, the intersection of the linear regression line and the y-axis (TN) gives an indication of the potential contribution of inorganic N to the TN signal (e.g., Schubert and Calvert, 2001).
Previous | Close | Next | Top of page