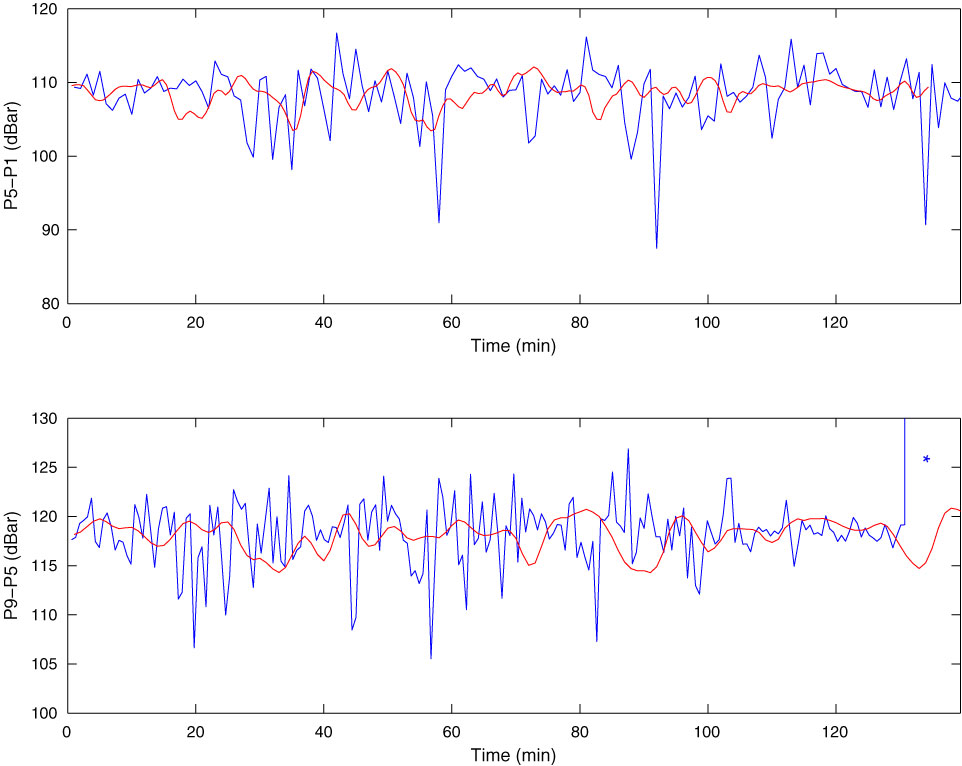
Figure F7. Pressure monitoring during the second SCIMPI deployment attempt. Top blue line = pressure difference of first (shallowest) and fifth (deepest) modules located 110 m apart. Bottom blue line = pressure difference of fifth and ninth modules located 117 m apart. Red lines = 3 point width Gaussian moving average filter. Asterisk = isolated points with high pressure recorded on Module 9 after touching bottom with the sinker bar and lifting pipe 2 m above.
Previous | Close | Next | Top of page