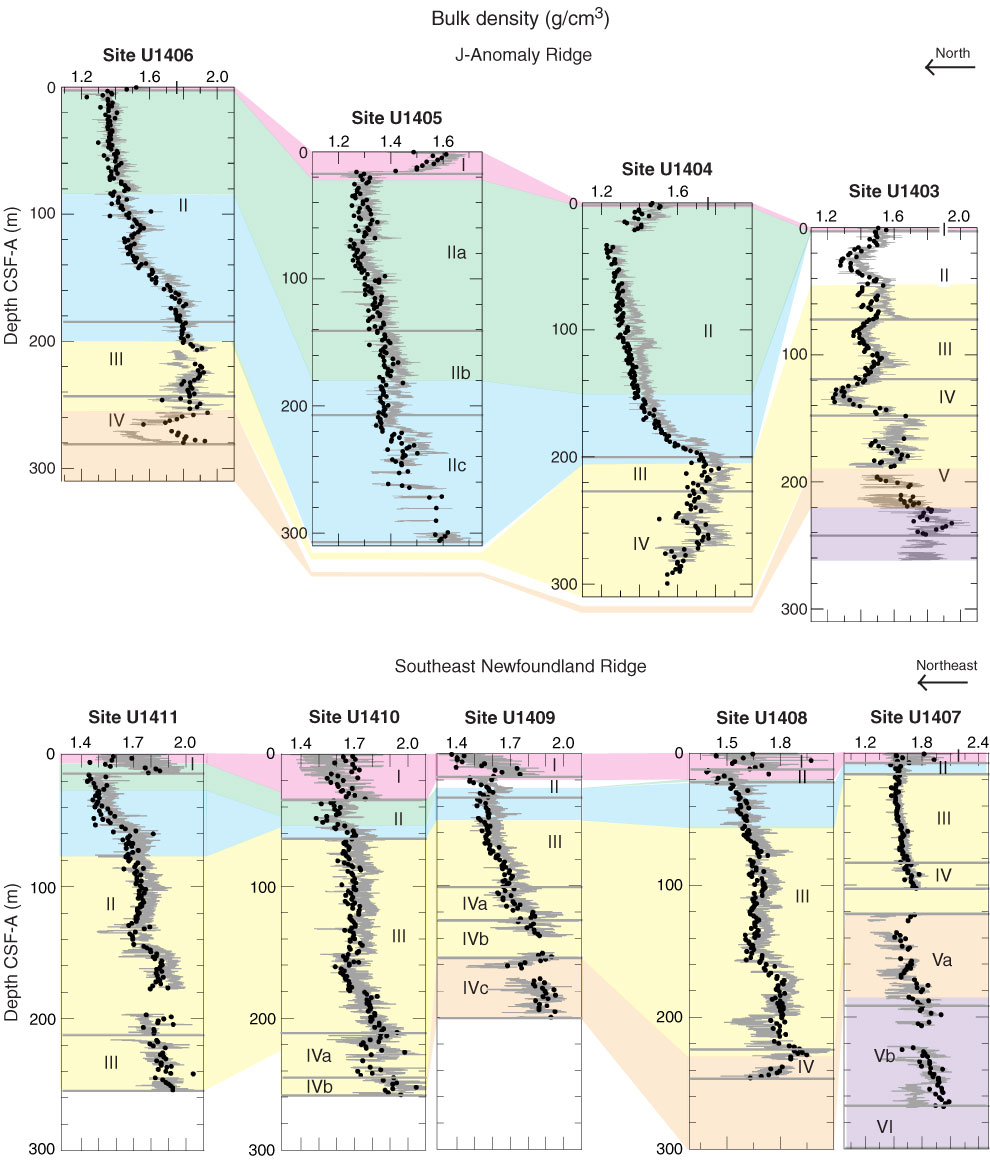
Figure F21. Plots of bulk density records at J-Anomaly and Southeast Newfoundland Ridge, Sites U1403–U1411. Black circles = discrete moisture and density measurements, gray lines = gamma ray attenuation core logging measurements converted to bulk density. Shaded areas follow stratigraphic color scheme shown in Figure F17.
Previous | Close | Next | Top of page