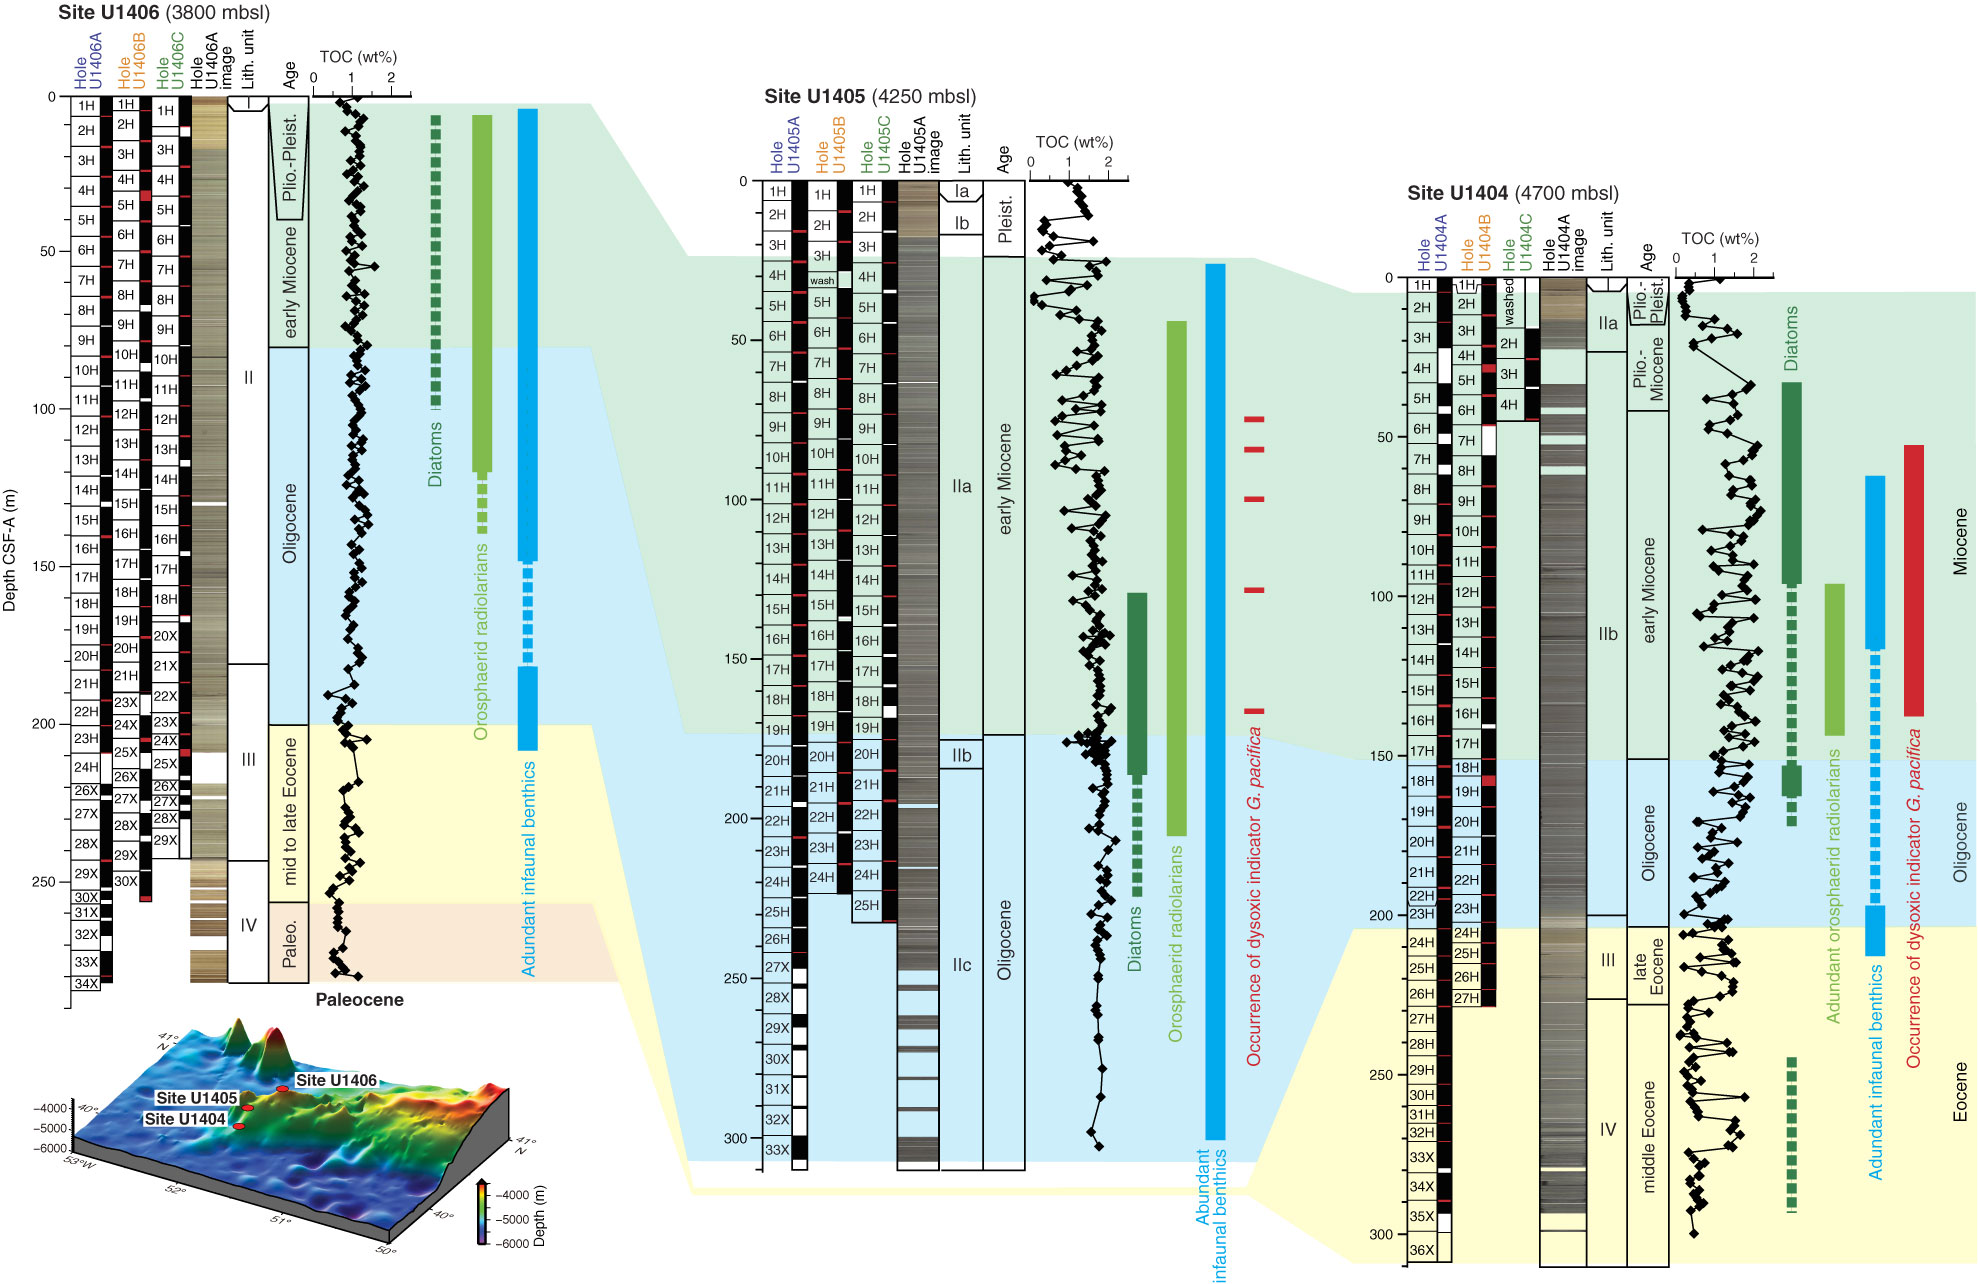
Figure F33. Stratigraphic distribution of high-productivity indicators, orophaerid radiolarians, and total organic carbon (TOC) values along J-Anomaly Ridge depth transect, Sites U1404–U1406. Bars indicate high abundances of individual fossil groups and dotted lines indicate lower abundances.
Previous | Close | Next | Top of page