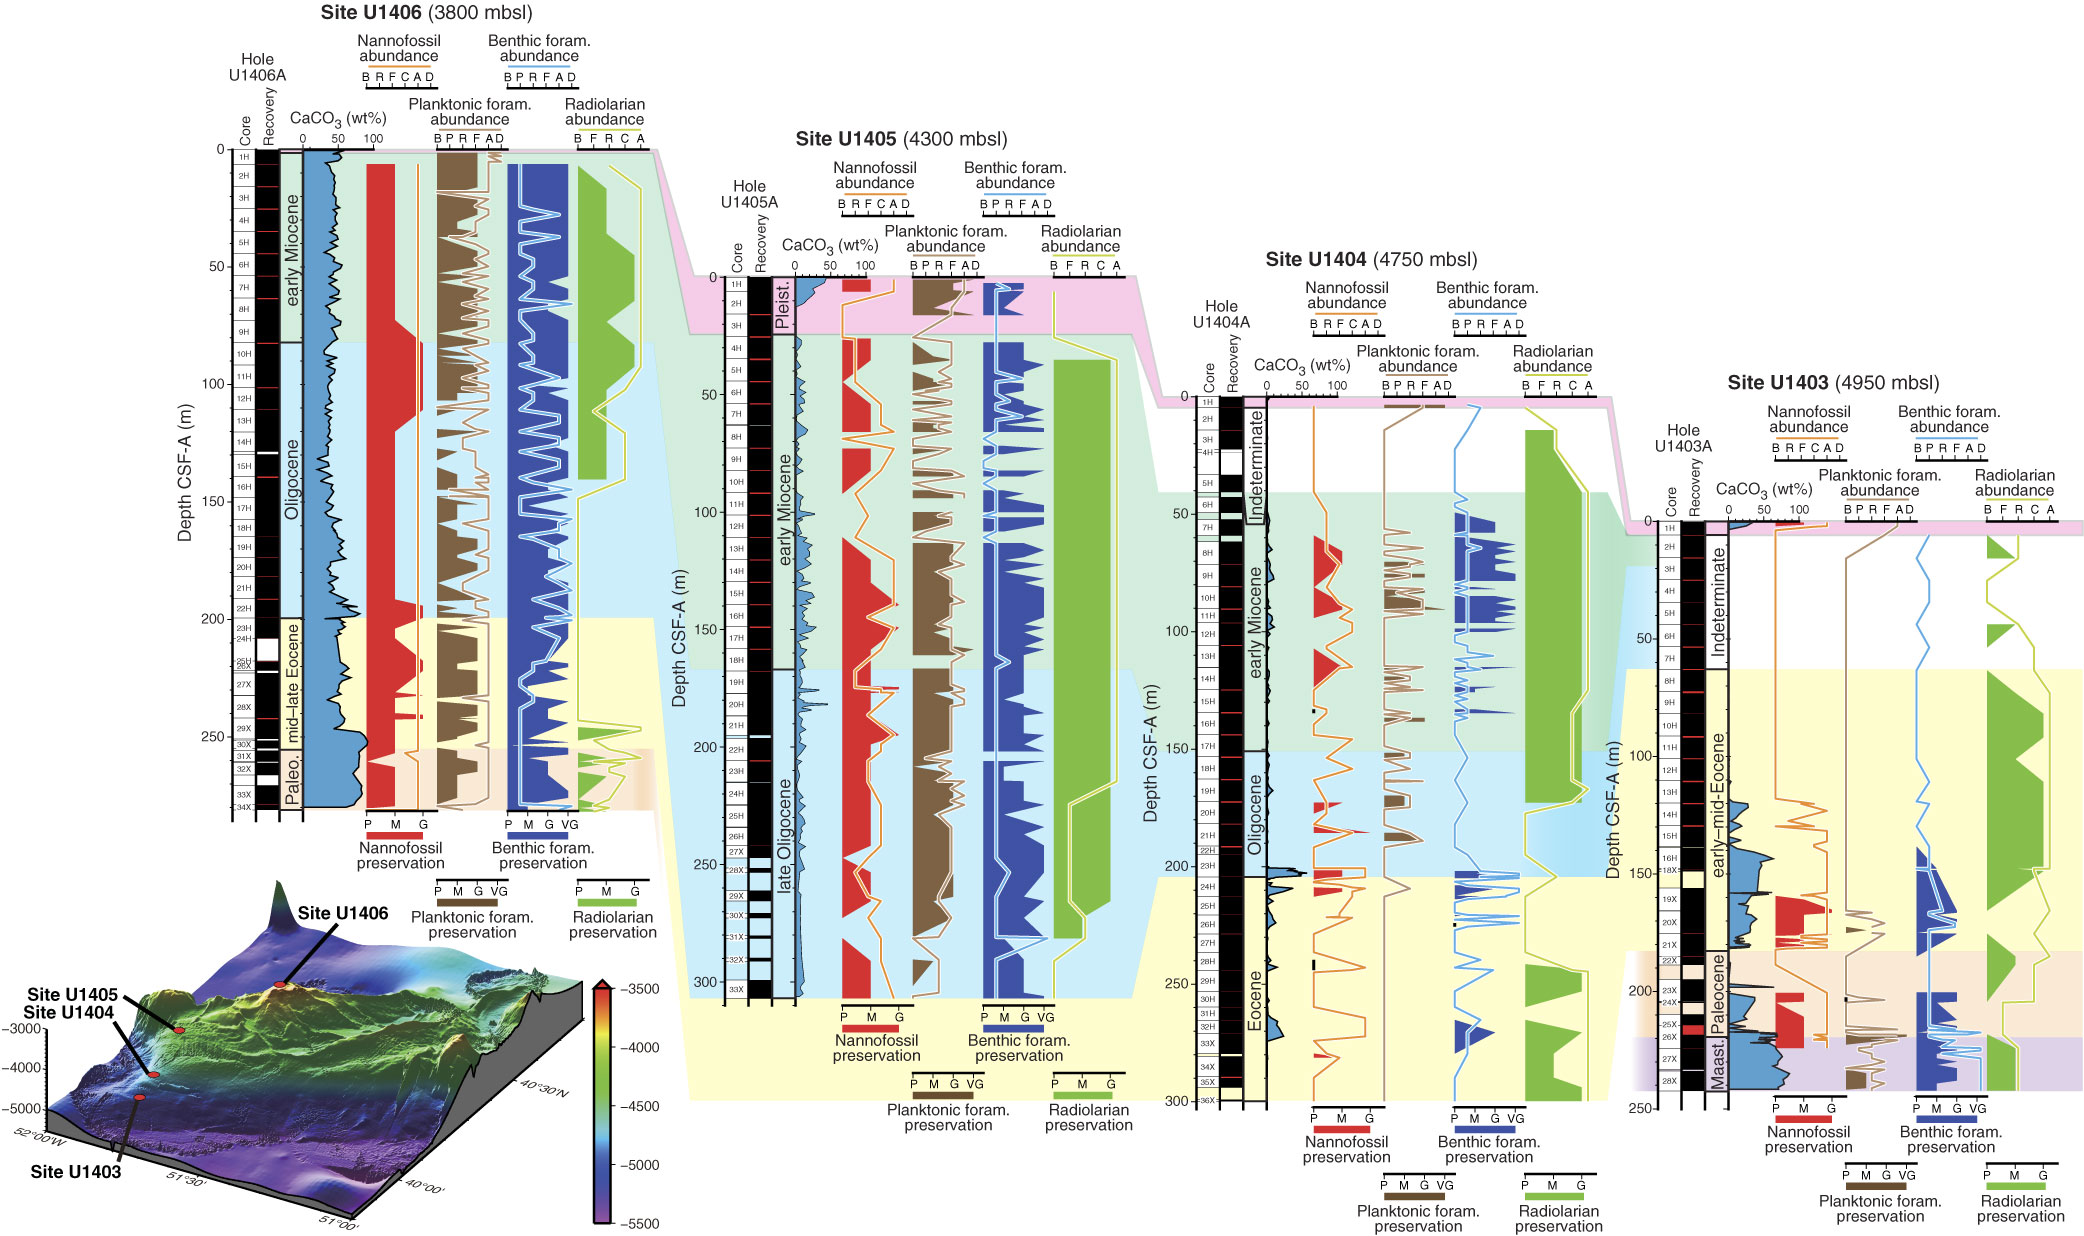
Figure F38. Stratigraphic distribution of microfossil abundance and preservation along the J-Anomaly Ridge depth transect, Sites U1403–U1406. Abundance: B = barren, P = present, R = rare, F = few, C = common, A = abundant, D = dominant. Preservation: P = poor, M = moderate, G = good, VG = very good.

Previous | Close | Next | Top of page