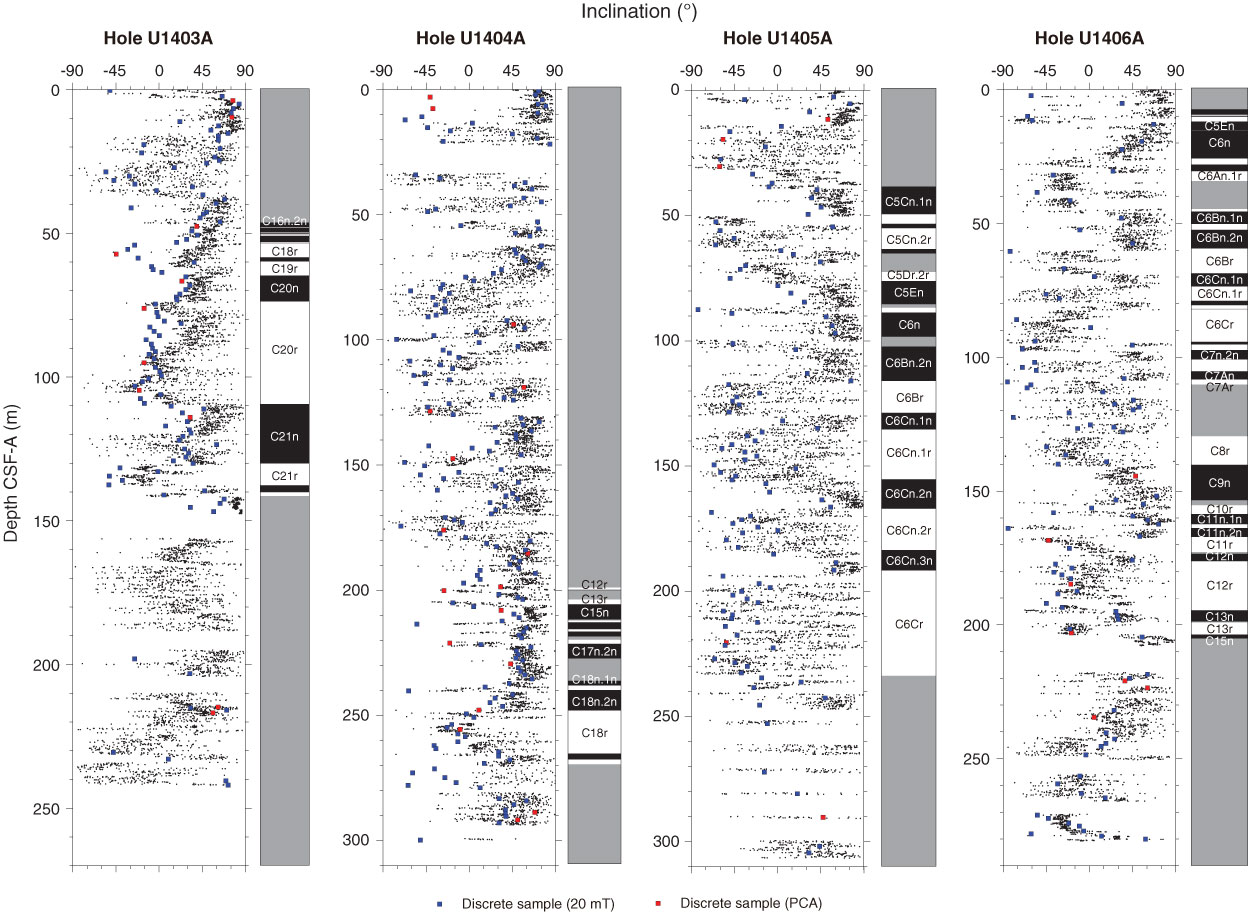
Figure F43. Plots of downhole paleomagnetic inclination for J-Anomaly Ridge Sites U1403–U1406. Interpreted magnetostratigraphies: black = normal, white = reversed chron, gray = unidentified. Small circles = pass-through SRM measurement data after 20 mT AF demagnetization from archive-half sections. PCA = principal component analysis experiments (Kirschvink, 1980).
Previous | Close | Next | Top of page