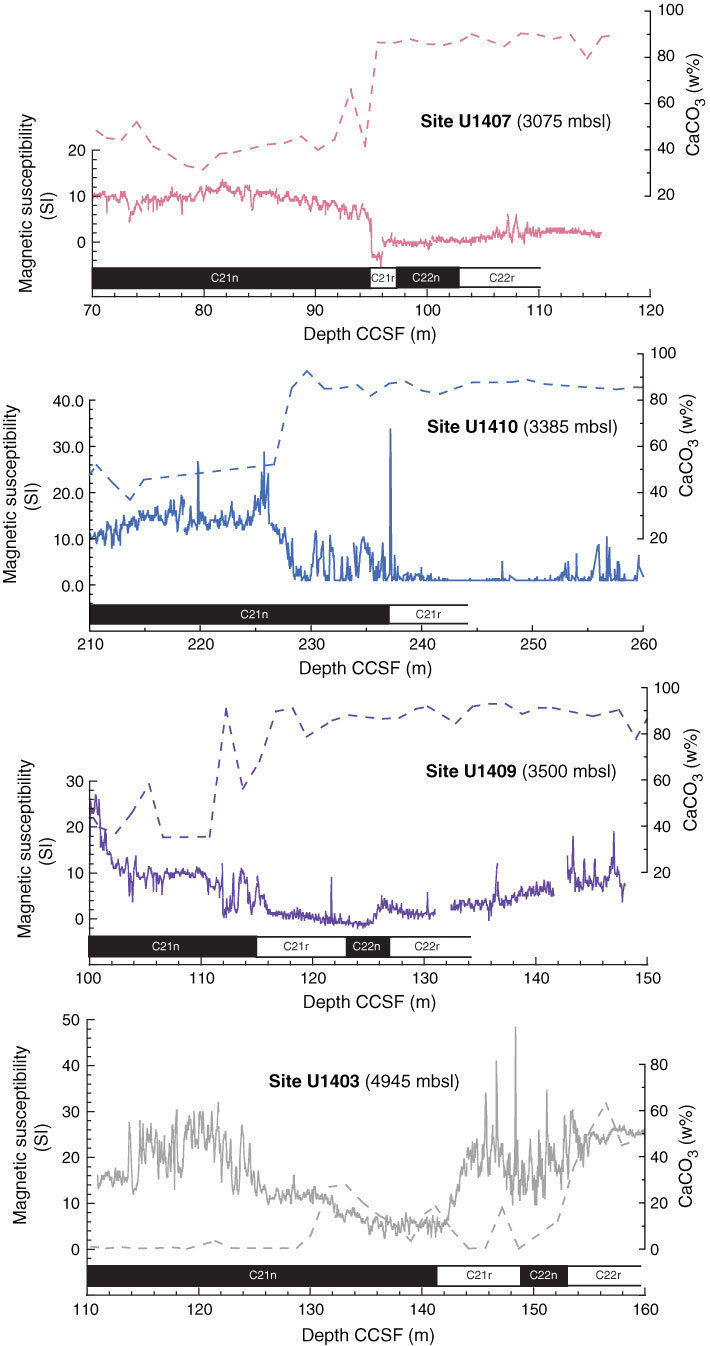
Figure F62. Plots of magnetic susceptibility and calcium carbonate records across the early–middle Eocene transition at Sites U1403 (gray), U1407 (pink), U1409 (purple), and U1410 (blue). Magnetic susceptibility records are from the spliced interval at each site, whereas carbonate data are from Hole A of each site. Chron boundaries are identified from Hole A of each site and converted to the CCSF depth scale.
Previous | Close | Next | Top of page