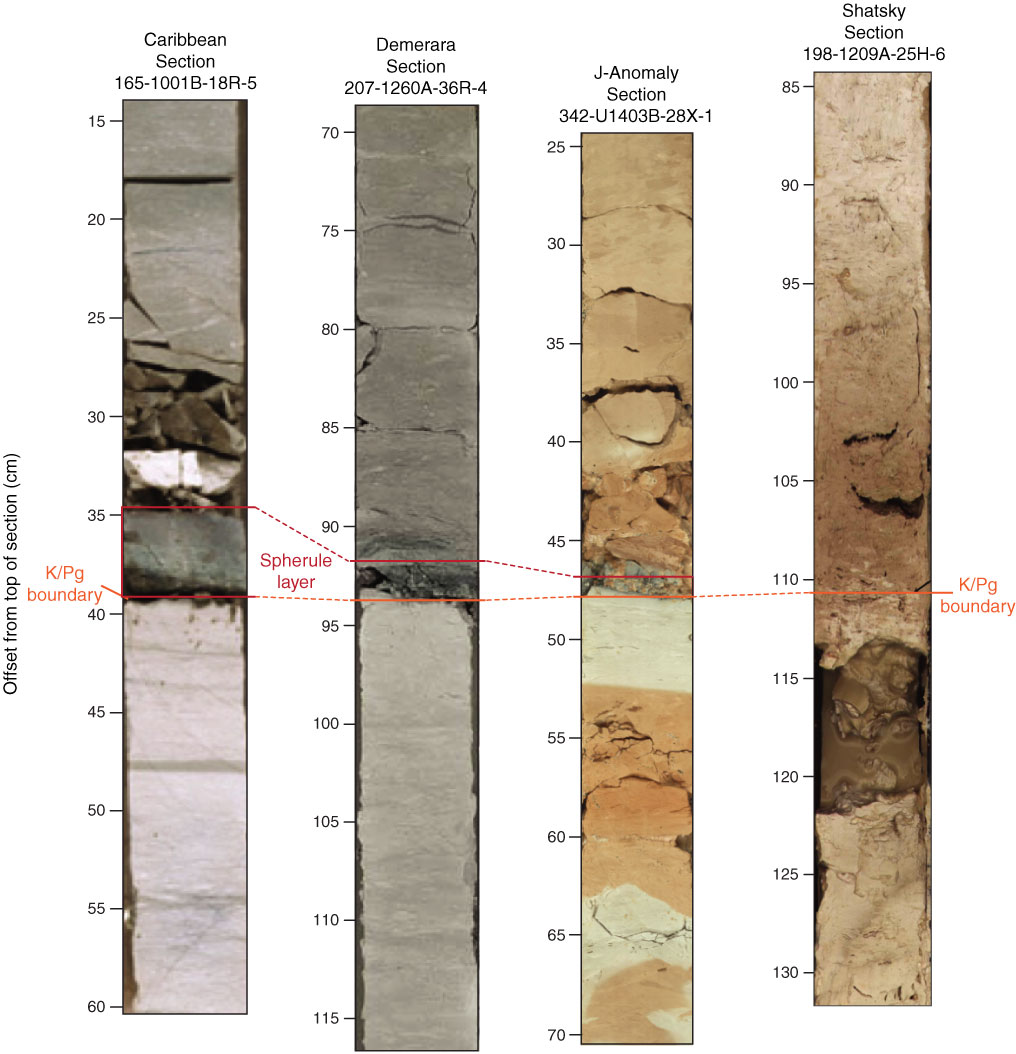
Figure F67. Core images of Cretaceous/Paleogene (K/Pg) boundary sections showing a range of spherule bed thickness. Spherule bed thickness ranges from >8 cm thick at sites proximal to the impact (e.g., Caribbean ODP Site 1001) to not observed in very distal sites with bioturbation (Shatsky Rise ODP Site 1209).

Previous | Close | Next | Top of page