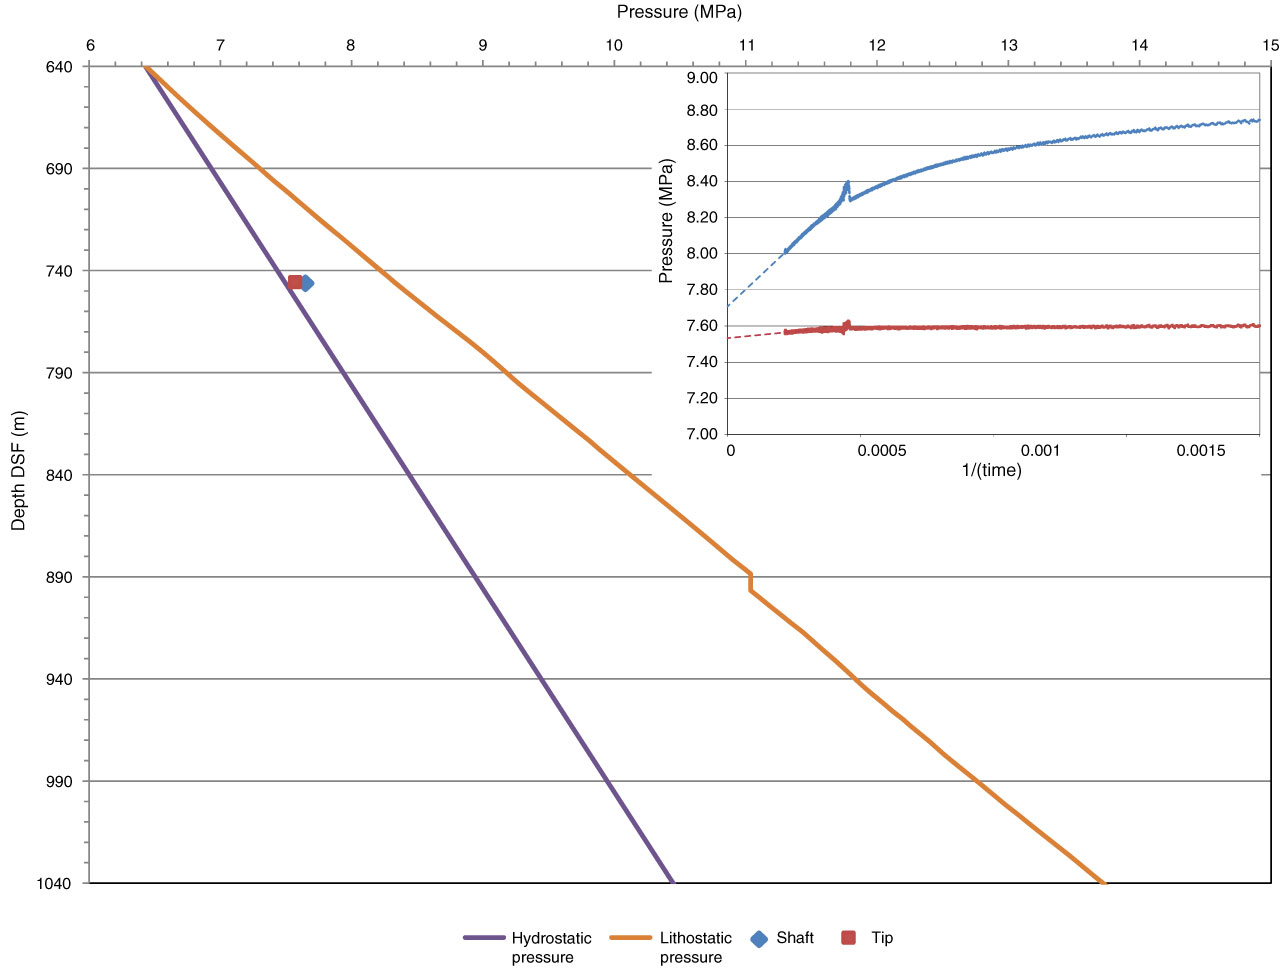
Figure F73. Plots predicting in situ pore pressure from T2P sensors as compared to the hydrostatic and lithostatic pressures, Expedition 342. Inset plot shows pressure in the shaft (blue line) and tip (red line) measured against inverse time. The intercept of these data is often used to estimate in situ pressure. The intercepts for the shaft and tip is 7.70 and 7.55 MPa, respectively. The main plot illustrates the estimated in situ pressure on a pressure depth plot. The in situ pressure is slightly above the hydrostatic pressure at this depth.
Previous | Close | Top of page