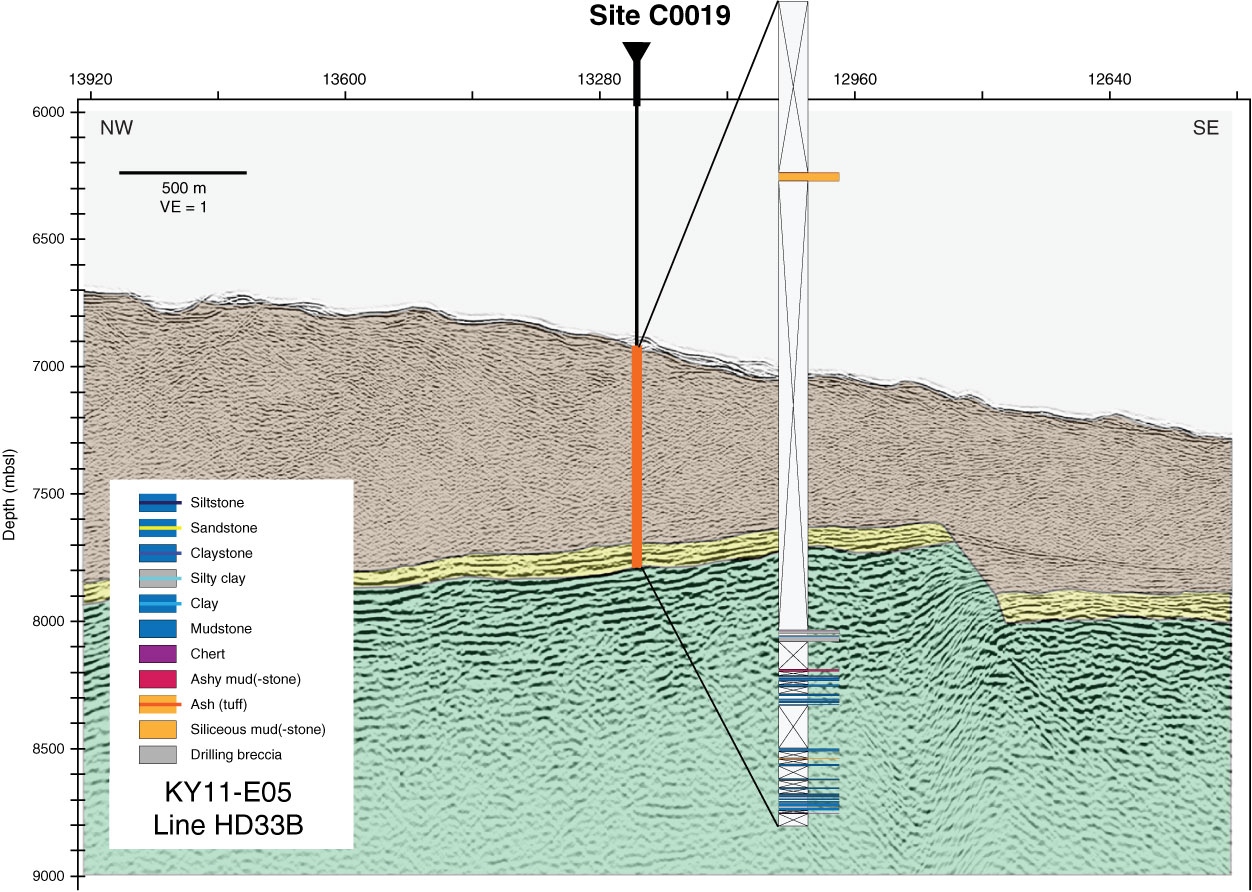
Figure F9. Graphical representation of intervals cored in Expedition 343 Hole C0019E. Time limitations demanded only targeted coring, so the majority of cores were taken from the intervals spanning the 720 and 820 faults. Lithology determined on the basis of visual core description (see text) is represented by color in the lithologic column. VE = vertical exaggeration.
Previous | Close | Next | Top of page