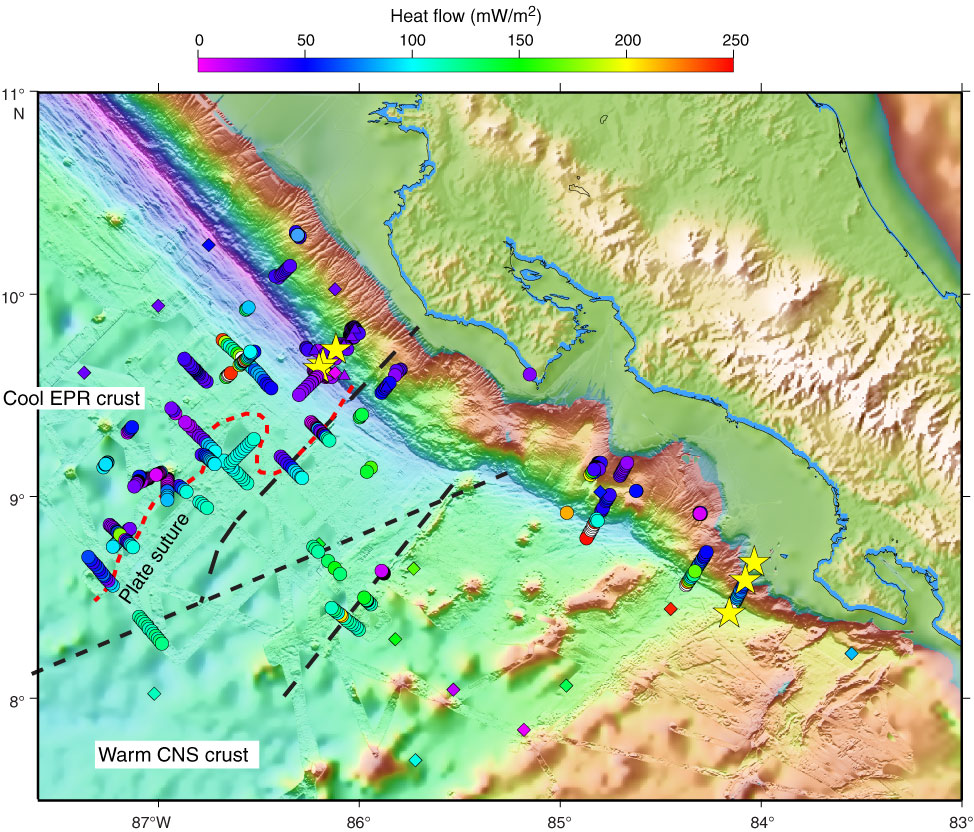
Figure F4. Heat flow data offshore Costa Rica. Color-coded circles indicate heat flow values (Von Herzen and Uyeda, 1963; Vacquier et al., 1967; Langseth and Silver, 1996; Fisher et al., 2003; Hutnak et al., 2007; Harris et al., 2010a). Stars show locations of Expedition 344 drill sites. Dashed red line indicates the position of the thermal transition between areas of relatively low and high heat flow. East Pacific Rise (EPR)-generated crust to the north of the triple junction and fracture zone traces has heat flow suppressed by roughly 70%, whereas Cocos-Nazca spreading center (CNS)-generated crust to the south generally has heat flow that matches conductive lithospheric cooling models (Hutnak et al., 2007, 2008).
Previous | Close | Next | Top of page