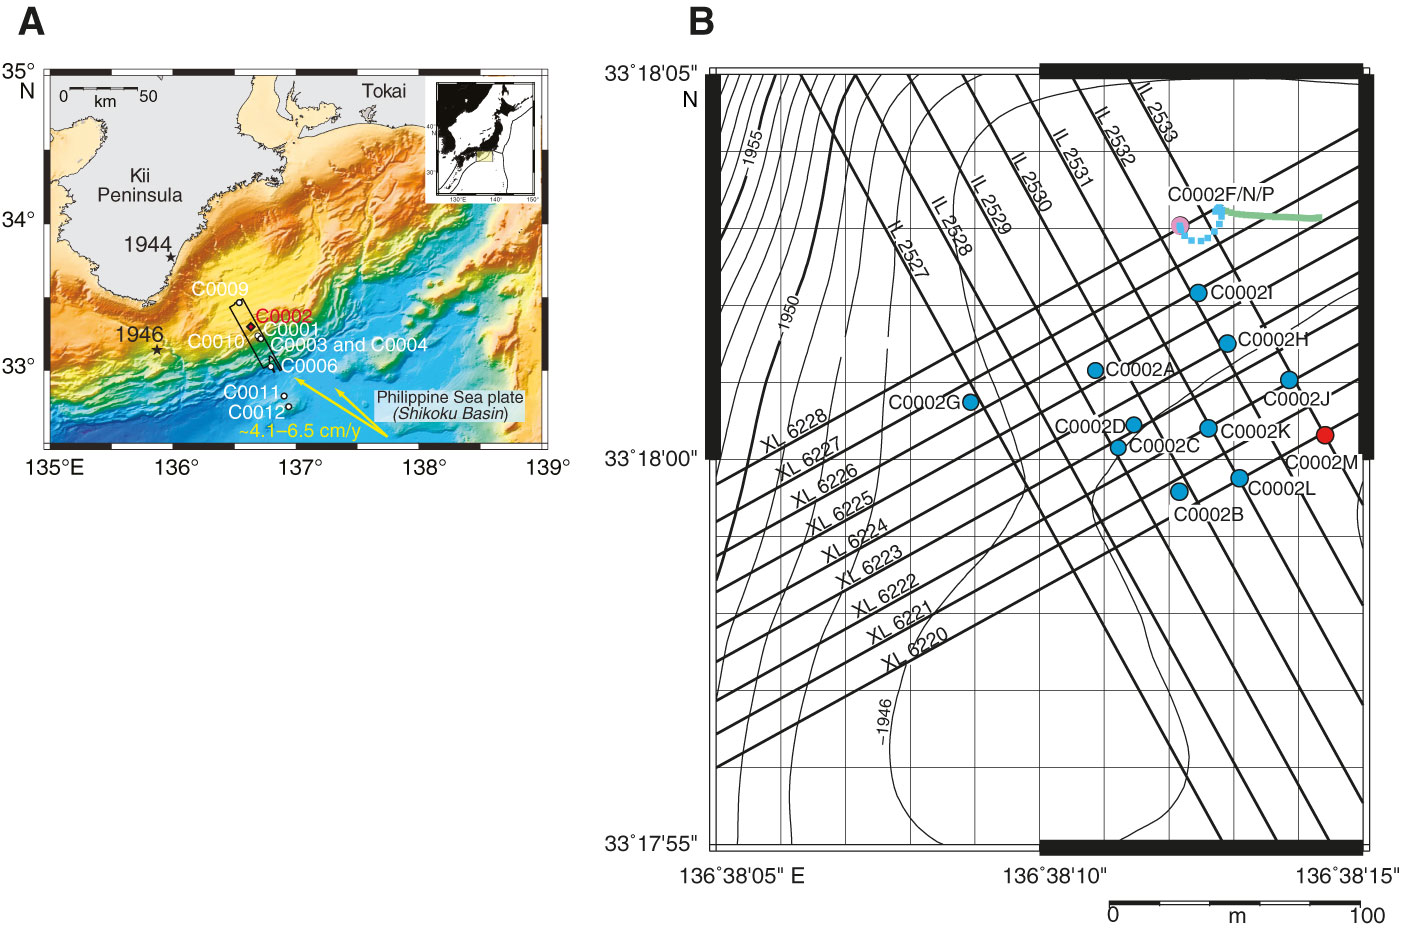
Figure F1. A. Map of the NanTroSEIZE region showing all Stage 1, 2, and 3 drill sites. Red = Expedition 348 Site C0002, white = other NanTroSEIZE sites. Black outline = region with 3-D seismic data, yellow arrows = estimated far-field vectors between Philippine Sea plate and Japan (Seno et al., 1993; Heki, 2007). Stars = epicenter locations of 1944 and 1946 tsunamigenic earthquakes. B. Bathymetric map showing all Site C0002 holes. The long-term borehole monitoring system is installed in Hole C0002G, and the riser hole is Hole C0002F/C0002N/C0002P. The lines from Hole C0002F show the azimuth and deflection of Holes C0002N (blue dashed line) and C0002P (green line) from the original Hole C0002F borehole.
Close | Next | Top of page