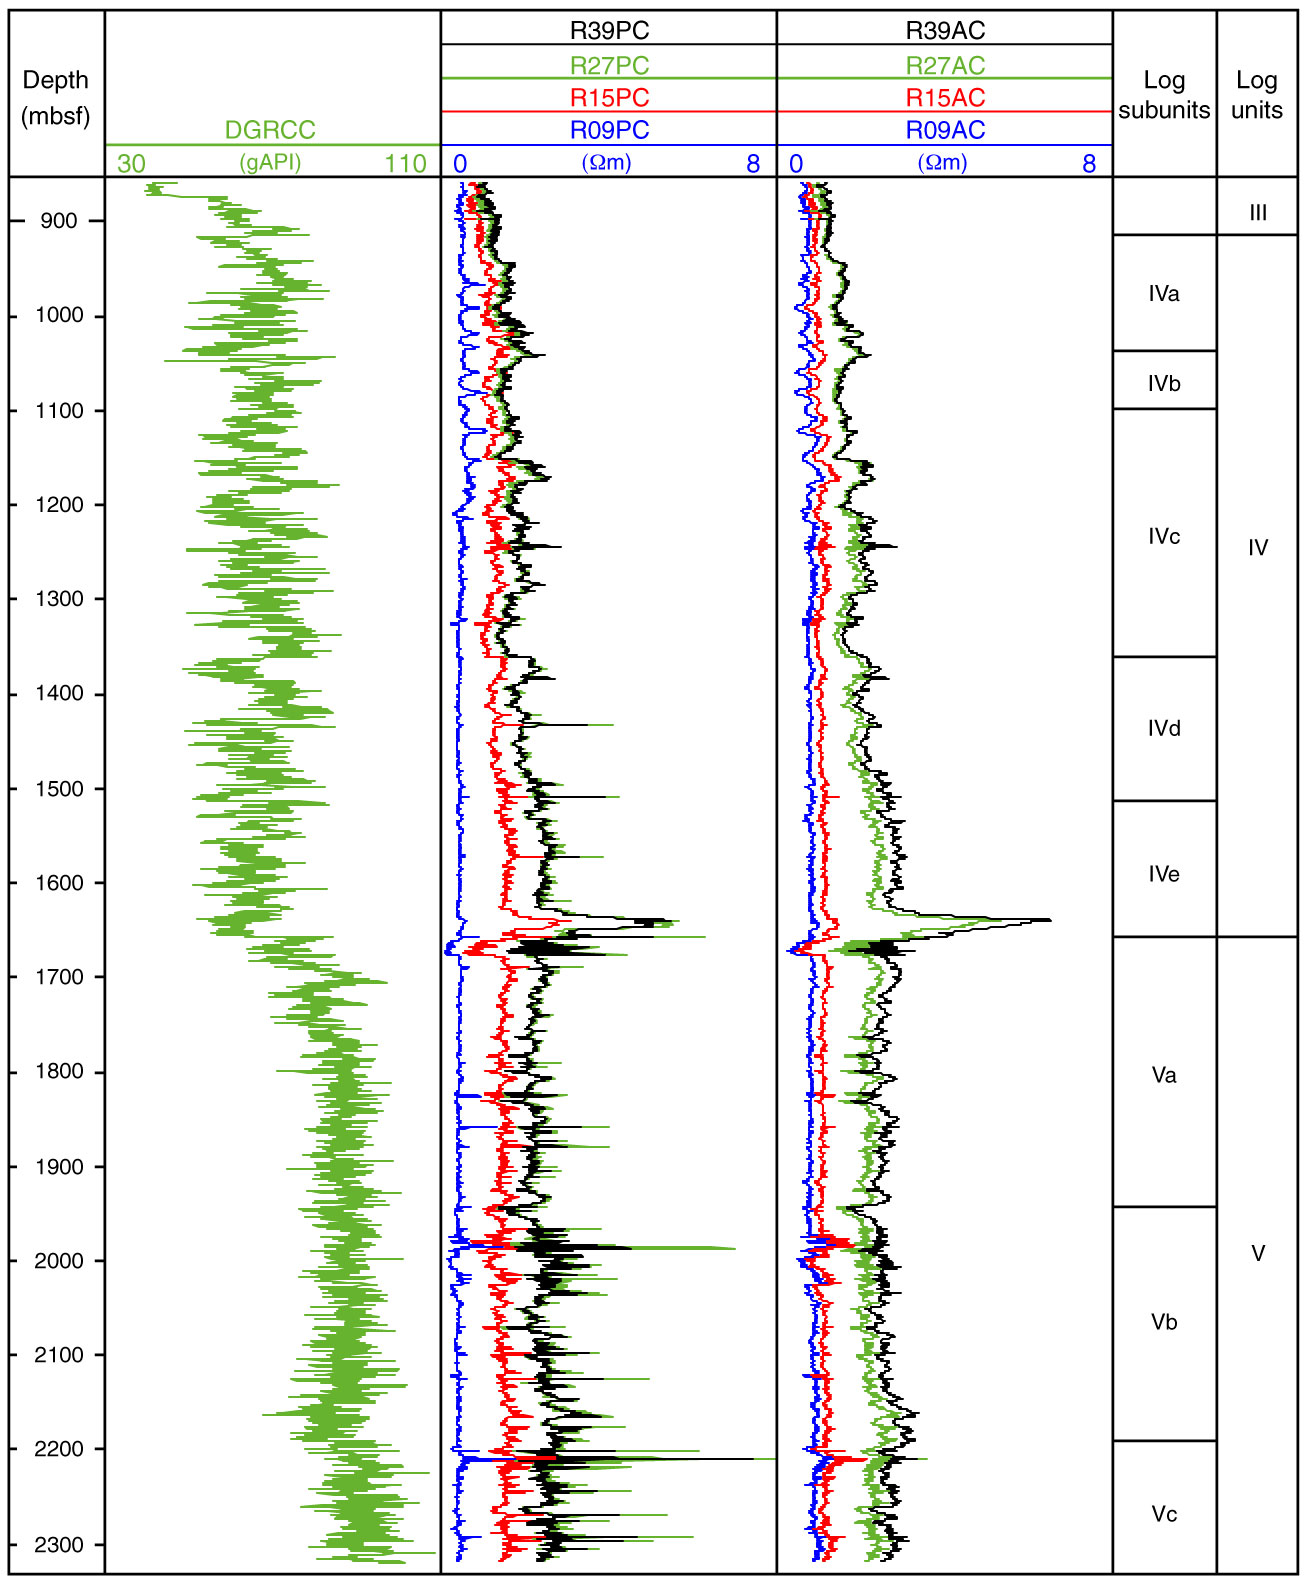
Figure F19. Composite plot of logging while drilling logs, Hole C0002N. Gamma ray (DGRCC), phase (PC), and attenuation (AC) resistivity curves for different sensor spacings (9, 15, 27, and 39 inch). The R09PC and R09AC short-spacing and, to a lesser degree, the R15PC and R15AC exhibit low resistivity values compared to those of the deep readings (R27PC, R39PC, R27AC, and R39PC). The short-spacing receivers record the response of the electromagnetic wave propagation in the mud, and the long-spacing receivers provide a measurement of the formation. Only deep resistivities were used in the geological interpretation.
Previous | Close | Next | Top of page