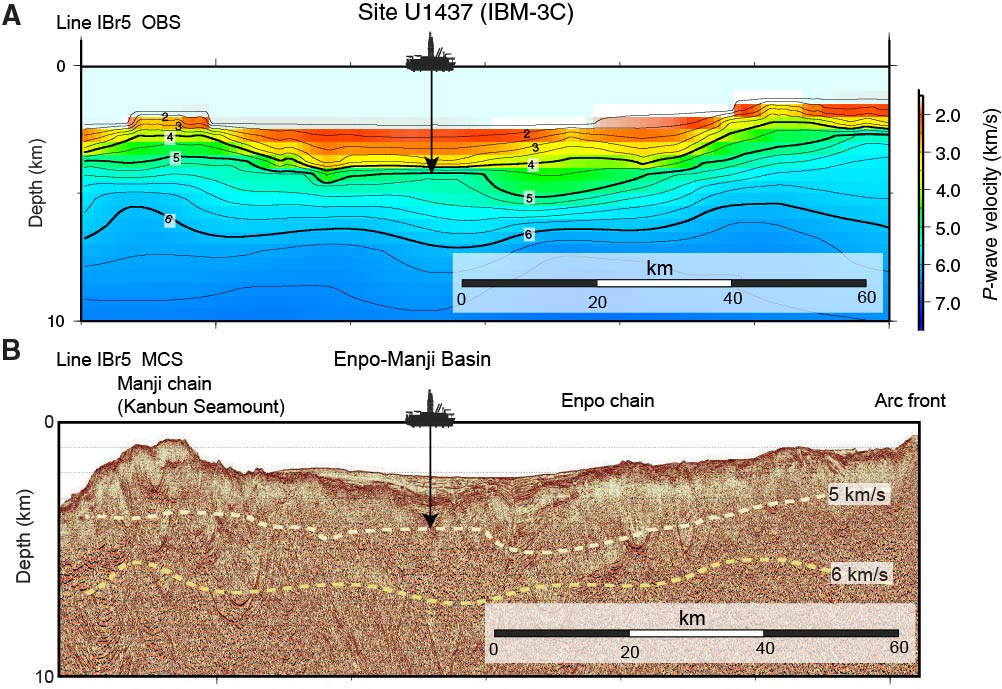
Figure F23. Seismic Line IBr5, which runs east from the Manji rear-arc seamount chain in the west to the arc front in the east, plotted on Figure F22B (M. Yamashita, per. comm., 2014). A. Seismic velocity image obtained from wide-angle ocean-bottom seismometer (OBS) data, with OBSs deployed every 5 km along Line IBr5. B. Depth-converted multichannel seismic (MCS) reflection profile along Line IBr5. Dashed yellow lines = iso-velocity contours of 5 and 6 km/s obtained from seismic velocity image in Figure F13A, which are interpreted as the depth to igneous basement (upper crust) and middle crust, respectively (M. Yamashita, per. comm., 2014).
Previous | Close | Next | Top of page