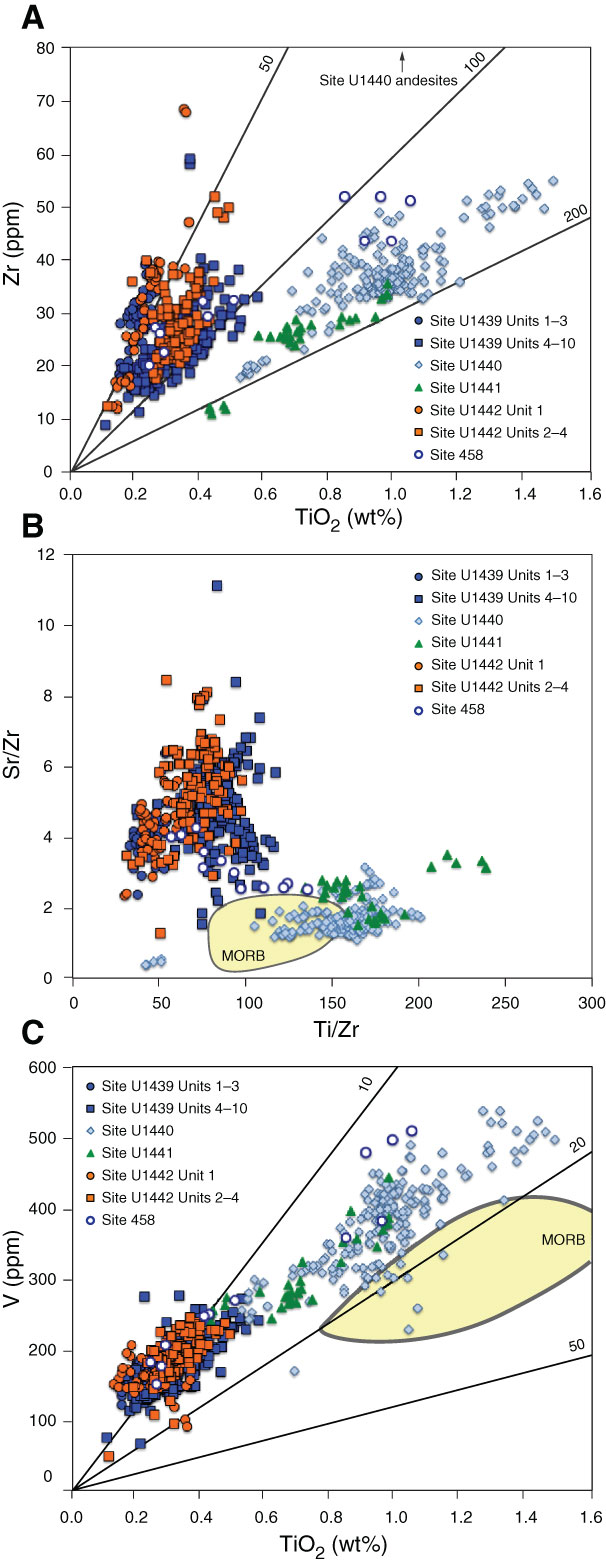
Figure F21. (A) Zr vs. TiO2, (B) Sr/Ti vs. Ti/Zr, and (C) V vs. TiO2 for Sites U1439–U1442 and selected cores from DSDP Site 458. Diagonal lines in A illustrate Ti/Zr ratios, and those in C represent Ti/V ratios. The yellow fields illustrate Pacific and Atlantic MORB compositions using the glass analyses of Jenner and O’Neill (2012).
Previous | Close | Next | Top of page