Previous | Close | Next
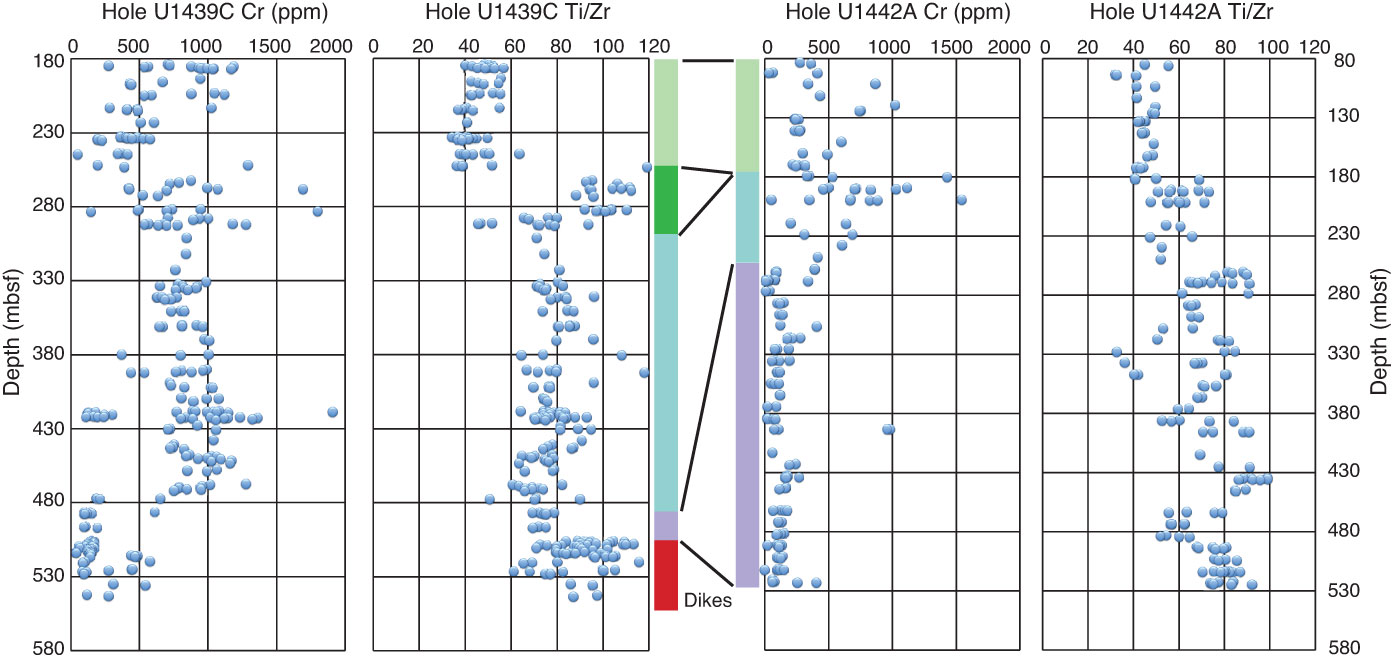
Figure F24. Cr concentrations and Ti/Zr ratios with depth, Holes U1439C and U1442A. The central colored bars represent our stratigraphic correlation between these two holes (see text for further explanation).
Previous | Close | Next | Top of page