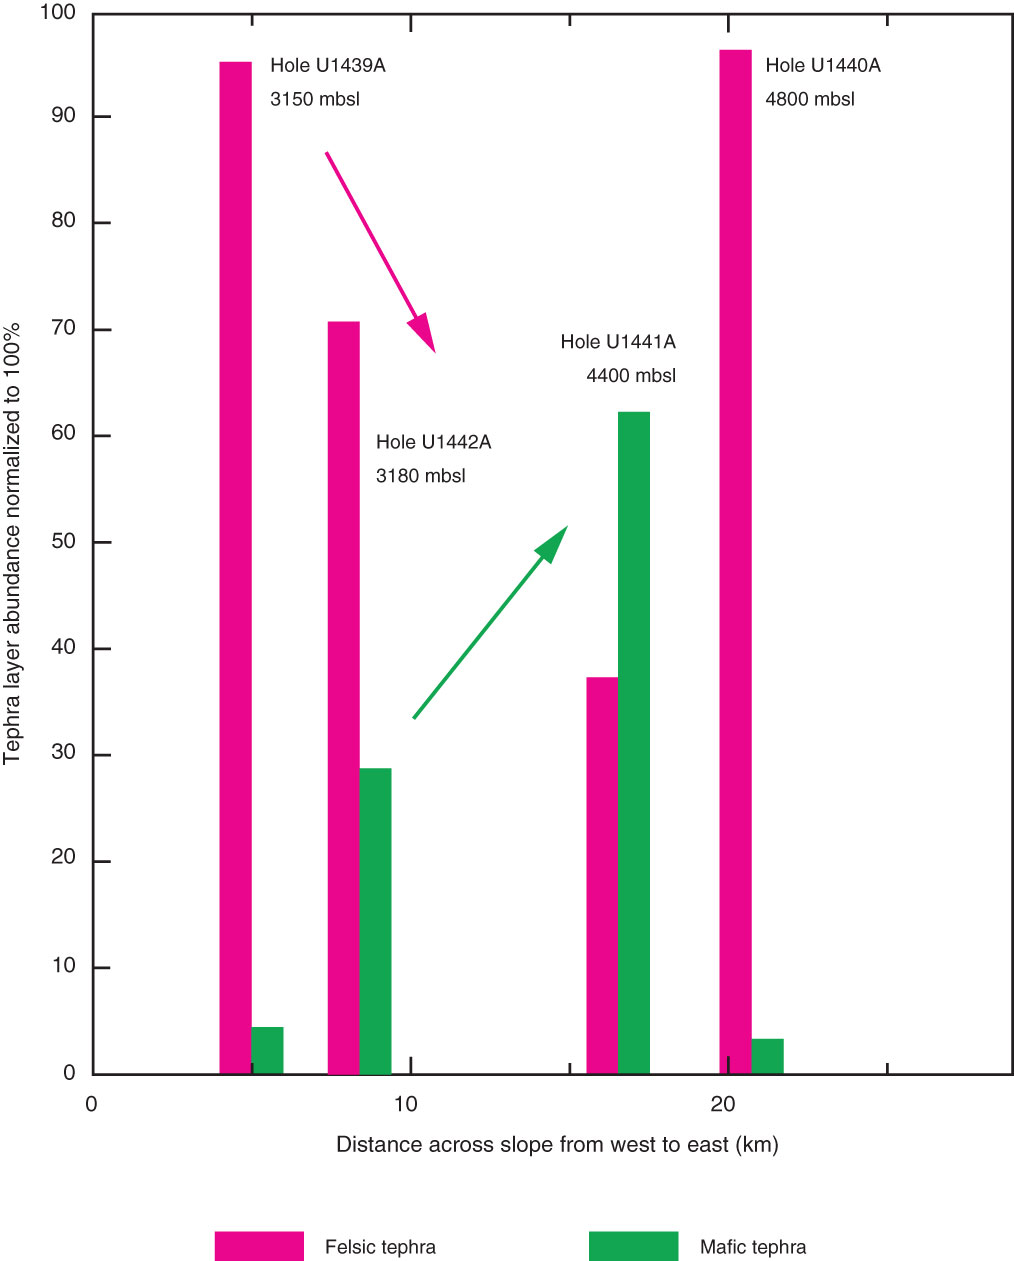
Figure F26. Normalized ash abundance, Sites U1439–U1442. Note different amounts of felsic and mafic ash layers across the slope. Arrows mark the decrease (pink) and increase (green) of felsic and mafic tephras, respectively.
Previous | Close | Top of page