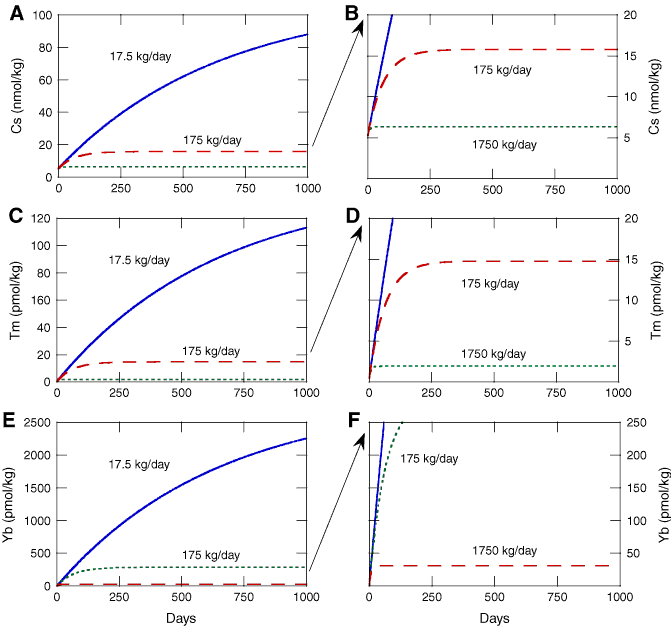
Figure F8. Calculations of expected tracer concentrations below the CORK in Hole U1301A. Tracer concentrations were estimated based on the size of the open interval, injectate concentration, rate of tracer injection, and formation fluid exchange rates of 17.5 to 1750 kg/day, as shown. These exchange rates were estimated based on results of earlier tracer dilution experiments in Holes 1024C and 1027C (Wheat et al., 2003). Three different tracers are being injected continuously at depth below CORKs in Holes 1026B, U1301A, and U1301B (Table T3). A. Calculated Cs concentration versus time, full scale. B. Calculated Cs concentration versus time, low scale. C. Calculated Tm concentration versus time, full scale. D. Calculated Tm concentration versus time, low scale. E. Calculated Yb concentration versus time, full scale. F. Calculated Yb concentration versus time, low scale.

Previous | Close | Next | Top of page