Previous | Close | Next
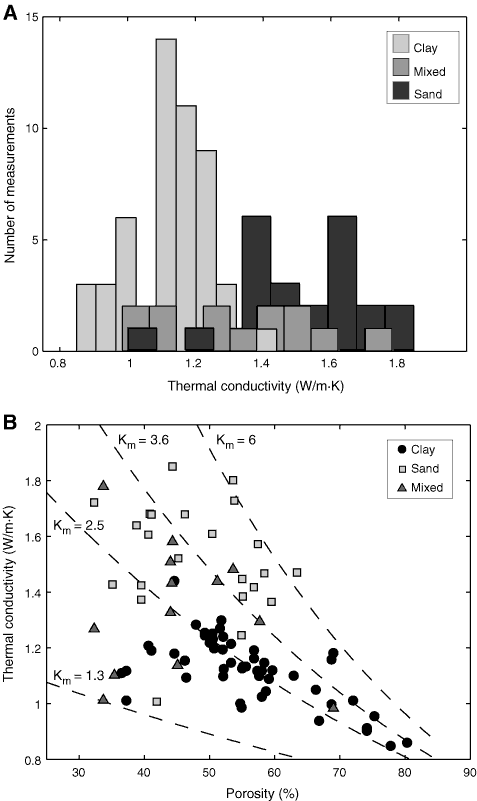
Figure F61. A. Histograms of thermal conductivity, showing a bimodal distribution based on lithology and sampling bias toward clay layers. B. Observed relationship between thermal conductivity and porosity.
Previous | Close | Next | Top of page