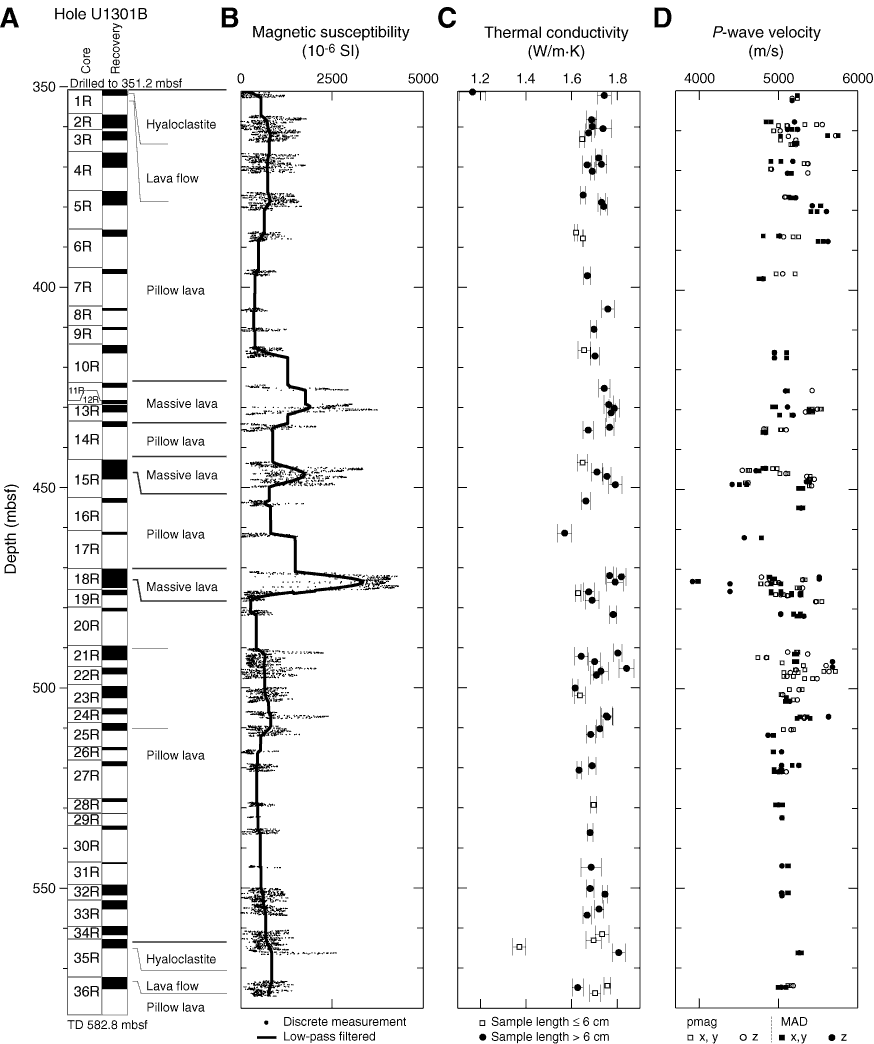
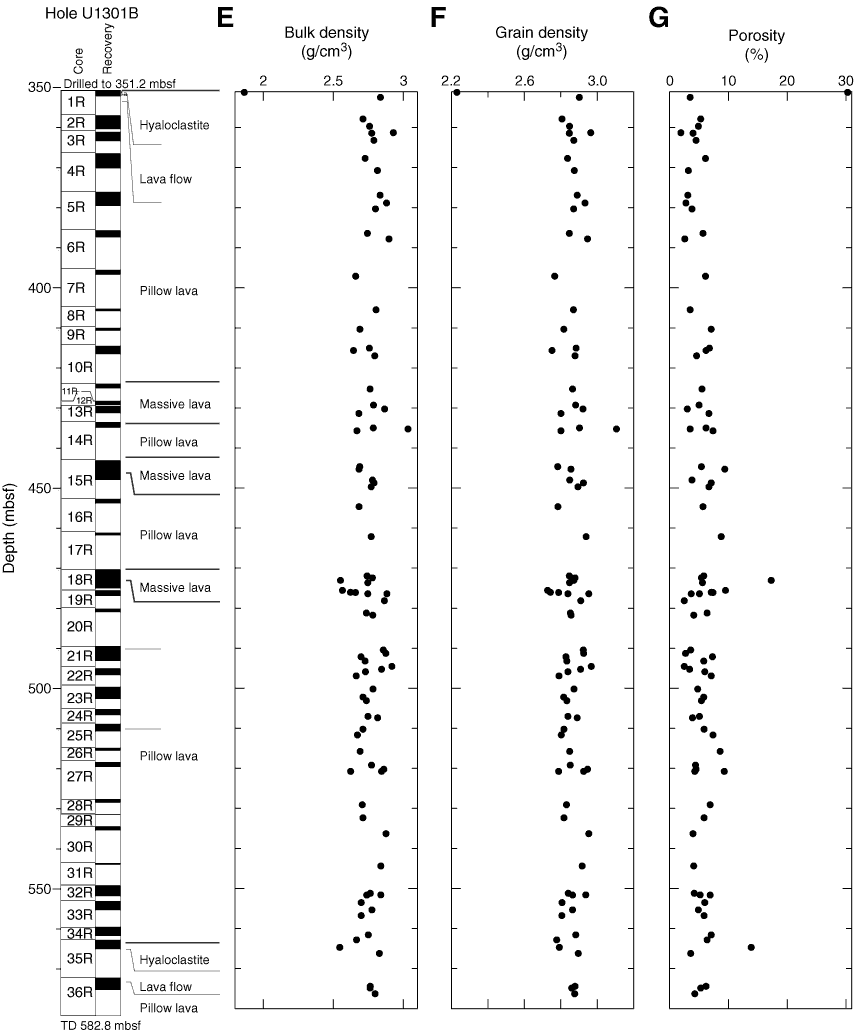
Figure F63. Summary plots for physical properties from the basement section of Hole U1301B. A. Core recovery, showing core number, portion recovered, and lithologic units. B. Magnetic susceptibility sampled at 1 cm intervals within the recovered sections. C. Thermal conductivity (see text for justification). Error bars denote 1 ![]() . The two lowest values correspond to hyaloclastite samples. D. Compressional P-wave velocity of samples collected for moisture and density (MAD) and paleomagnetic analysis. Velocities of paleomagnetic samples consistently demonstrate a wider range of values than those measured on MAD samples, which is likely attributable to nonparallel faces on the paleomagnetic samples (see text for details). TD = total depth. E. Bulk density of MAD samples, with the low value at ~352 mbsf corresponding to a highly brecciated sample. F. Grain density is shown, with the lowest value of ~2.2 g/cm3 corresponding to a brecciated sample at a depth of ~352 mbsf. G. The same brecciated sample yields the highest porosity value (almost 30%), and a second highly porous sample (~13%) was recovered at a depth of ~565 mbsf.
. The two lowest values correspond to hyaloclastite samples. D. Compressional P-wave velocity of samples collected for moisture and density (MAD) and paleomagnetic analysis. Velocities of paleomagnetic samples consistently demonstrate a wider range of values than those measured on MAD samples, which is likely attributable to nonparallel faces on the paleomagnetic samples (see text for details). TD = total depth. E. Bulk density of MAD samples, with the low value at ~352 mbsf corresponding to a highly brecciated sample. F. Grain density is shown, with the lowest value of ~2.2 g/cm3 corresponding to a brecciated sample at a depth of ~352 mbsf. G. The same brecciated sample yields the highest porosity value (almost 30%), and a second highly porous sample (~13%) was recovered at a depth of ~565 mbsf.
Previous | Close | Next | Top of page