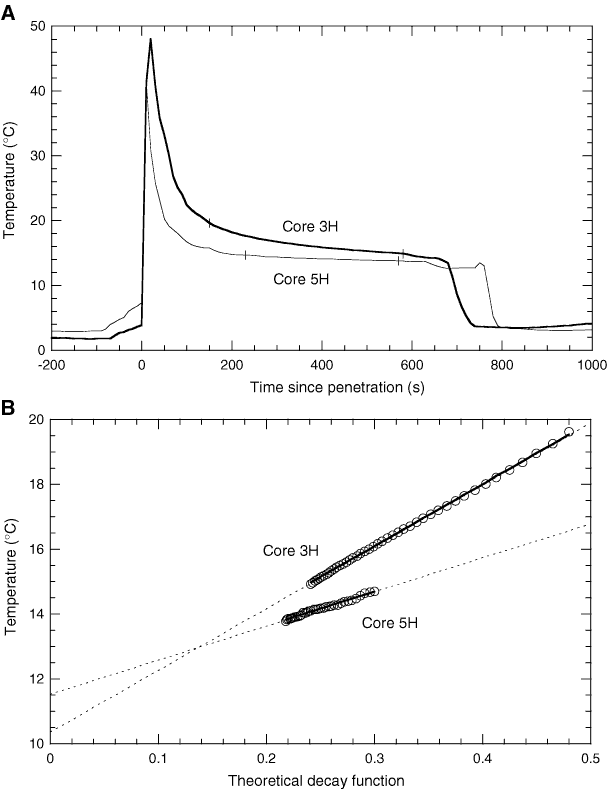
Figure F67. Temperature versus time and interpreted equilibrium temperatures for Hole U1301C deployments (Cores 301-U1301C-3H and 5H) of the APCT tool. A. Temperature versus time, shifted to show time since tool penetration. Small vertical bars indicate the range of data used in subsequent analyses of equilibrium temperatures. B. Plots of temperature versus the theoretical decay function for the APCT tool, based on a one-dimensional radial model of tool cooling (Horai and Von Herzen, 1985). As time goes to infinity, the function goes to zero, so the temperature intercept indicates the predicted equilibrium temperature.

Previous | Close | Next | Top of page