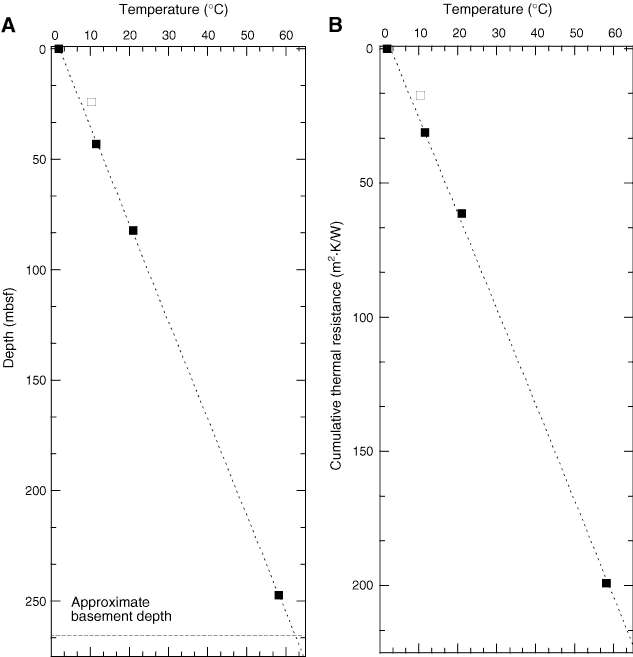
Figure F69. Thermal gradient and heat flow plots. A. Temperatures versus depth in Hole U1301C. Solid squares are from deployments used to derive the gradient by linear regression (dashed line), 0.228°C/m. The value at z = 0 is bottom water. The open square is from the APCT tool deployment in Core 301-U1301C-3H and was not used in the analysis. Estimated uncertainties in equilibrium values are smaller than the symbols used to plot the data. B. "Bullard" plot of temperature versus thermal resistance. The slope of the dashed line indicates heat flow of 280 mW/m2.
Previous | Close | Next | Top of page