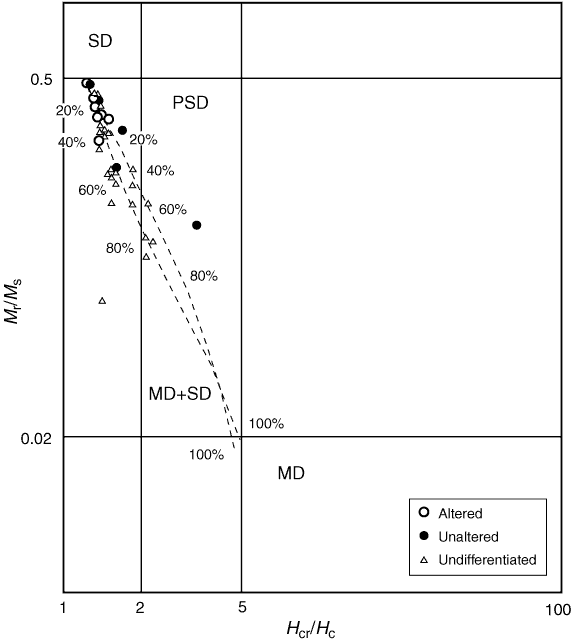
Figure F6. Mr/Ms vs. Hcr/Hc Day plot for basalt samples, Hole U1301B. Vertical and horizontal lines define boundaries of different magnetic grain size fields: SD = single domain, PSD = pseudosingle domain, MD = multidomain. Dotted lines show two example mixing lines for combinations of single and multidomain grains (Dunlop, 2002). Plot axes are logarithmic.
