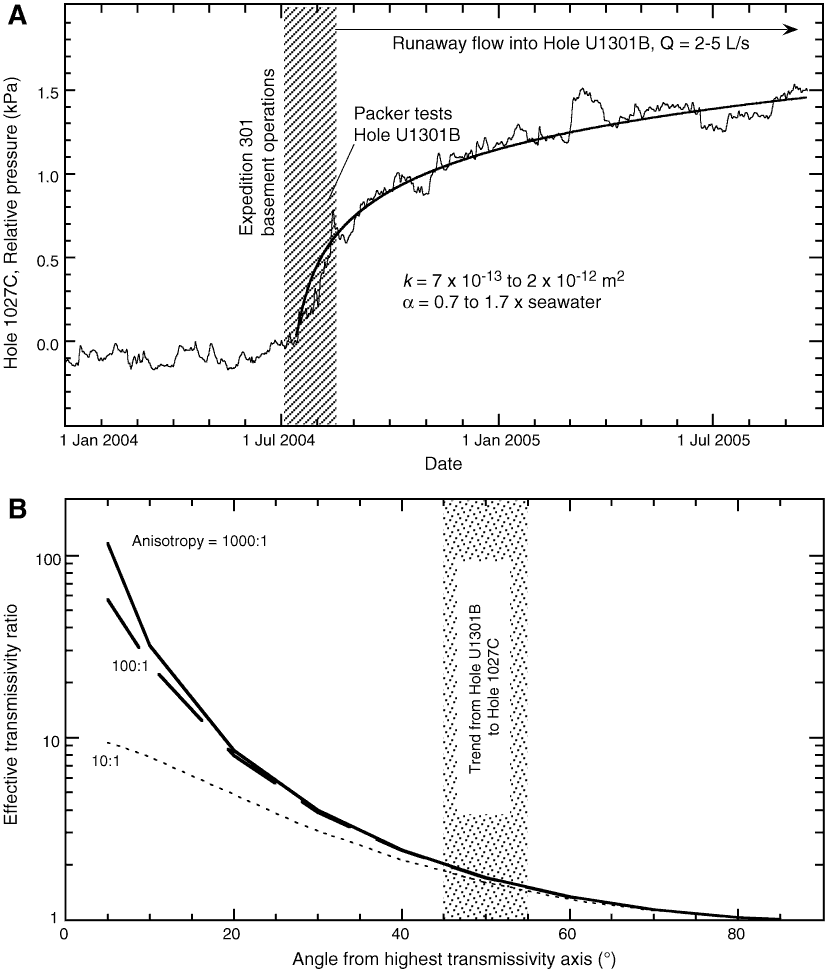
Figure F5. Observations and calculations from crosshole test. A. Filtered pressure time record from Hole 1027C, beginning 6 months before and ending 13 months after Expedition 301 (modified from Fisher et al., 2008). Striped vertical band = period of basement drilling, coring, casing, and testing operations during Expedition 301. Smooth curve shows least-squares best fit of observations to analytical calculations for the pressure response in Hole 1027C to flow into Hole U1301B. B. Calculations of the effective transmissivity ratio (apparent transmissivity/highest transmissivity) as a function of the angle of measurement. Vertical band = orientation of the Site U1301 to Site 1027 experiment, assuming that the direction of highest transmissivity is N20°E (subparallel to the crustal fabric) and the direction of lowest transmissivity is perpendicular to this, N110°E. The orientation of Site 1027 from Site U1301 is N50°E.
Previous | Close | Next | Top of page