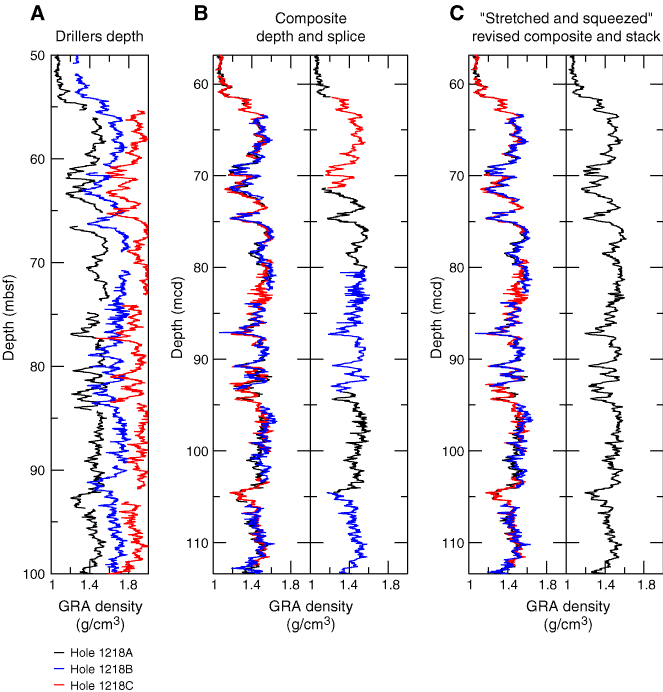
Figure F6. A. Selected interval of MS data from Holes 1218A, 1218B, and 1218C shown on the mbsf depth scale. Data from Holes 1218B and 1218C are offset by a constant for clarity. B. The same records are shown after depth-scale adjustment so that correlative features are aligned. C. The resulting spliced record is shown utilizing cores from Holes 1218A and 1218B.

Previous | Close | Next | Top of page