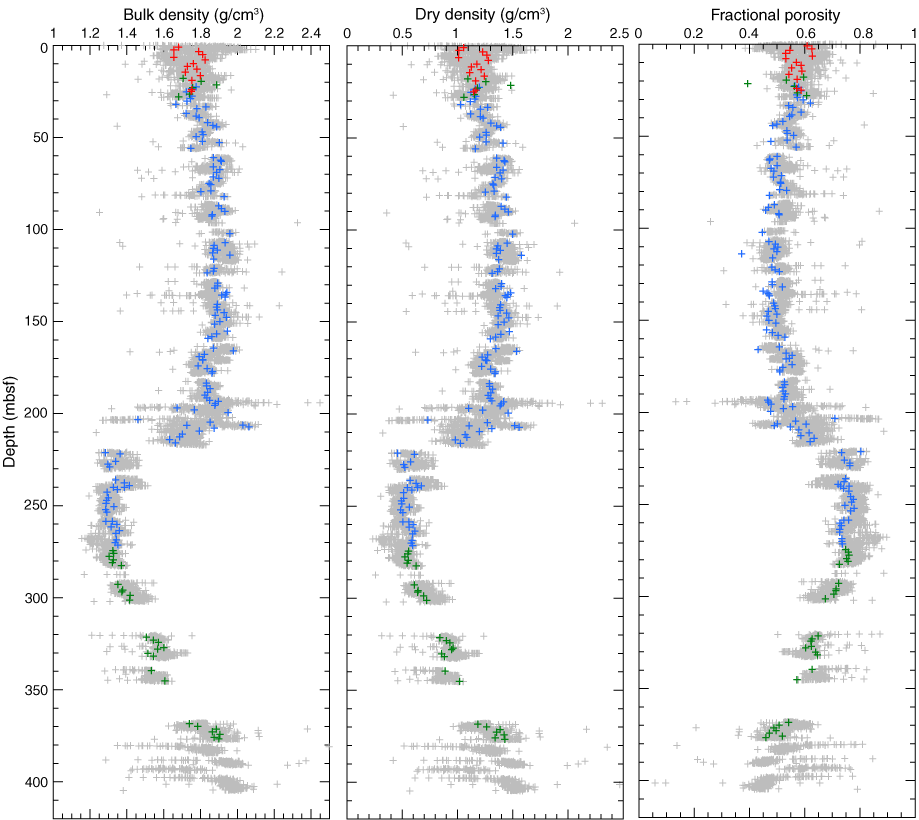
Figure F5. Downhole corrected and derived MSCL data and MAD measurements of ρB, ρD, and ϕ. Data have been cleaned by removing all ρB measurements <1.2 g/cm, the top 5 cm from all sections, the last measurement from all sections, and all data corresponding to disturbed intervals as tabulated in T24 from the “Sites M0001–M0004” chapter. Average grain density for lithologic unit/subunits are used to calculate ρD and ϕ from corrected MSCL ρB and are shown on ρD downhole plots. Data have not been migrated onto composite depth scale. Colors indicate hole from which MAD data is taken (red = Hole M0004C, blue = Hole M0002A, green = Hole M0004A).

Previous | Close | Top of page