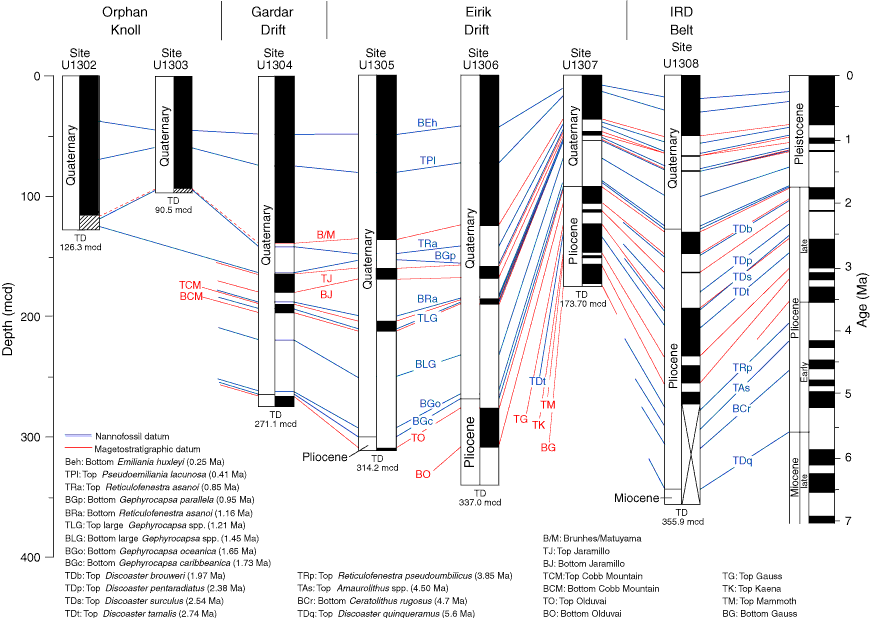
Figure F4. Schematic stratigraphy at the seven sites drilled during Expedition 303. The geomagnetic polarity timescale is shown on the right. The normal and reversed polarity zones are indicated in black and white, respectively. Hatched intervals indicate uncertain polarity in the debris flow of Sites U1302 and U1303. Blue tie lines = nannofossil datums and correlations, red tie lines = magnetostratigraphic correlations. TD = total depth.

Previous | Close | Next | Top of page