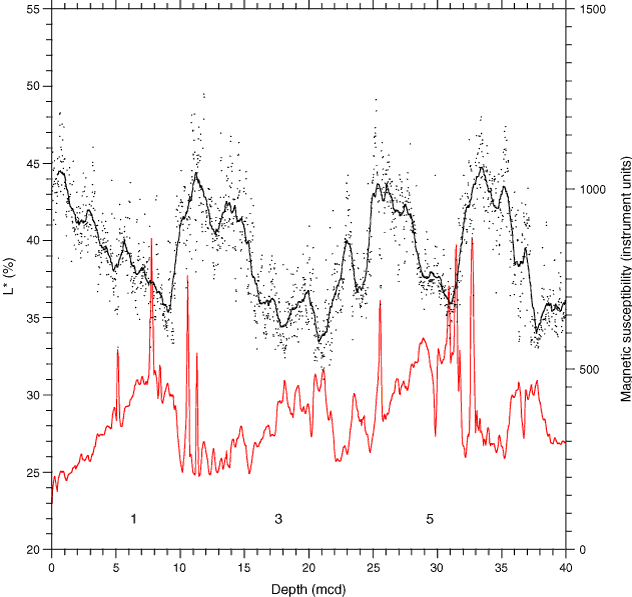
Figure F15. Comparison of the splice composite for sediment lightness (L*) and magnetic susceptibility (MS) from Site U1305. L* individual data are shown as small dots. A 40 point boxcar filter equivalent to 80 cm length was used to smooth the data for presentation. The MS is shown as a red line. Marine isotope Stages (MIS) 1, 3, and 5 are identified along the bottom of the graph and were identified by correlating to the MS record to Core MD99-2227 and its δ18O record (see Fig. F14).
Previous | Close | Next | Top of page