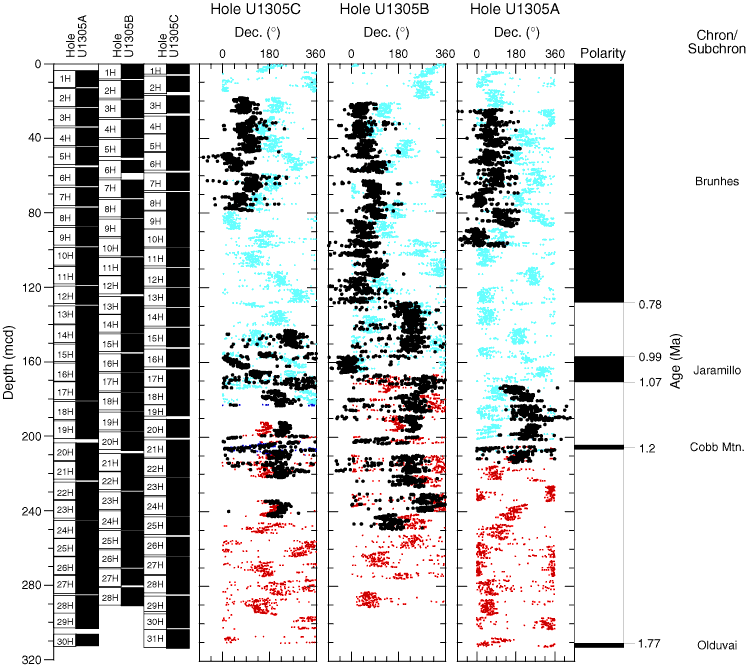
Figure F20. Site U1305 declination after peak AF demagnetization (10 mT = light blue, 15 mT = dark blue, 20 mT = red) and after tensor tool correction (black) versus depth (mcd). Core recovery is shown in the left panel.

Previous | Close | Next | Top of page