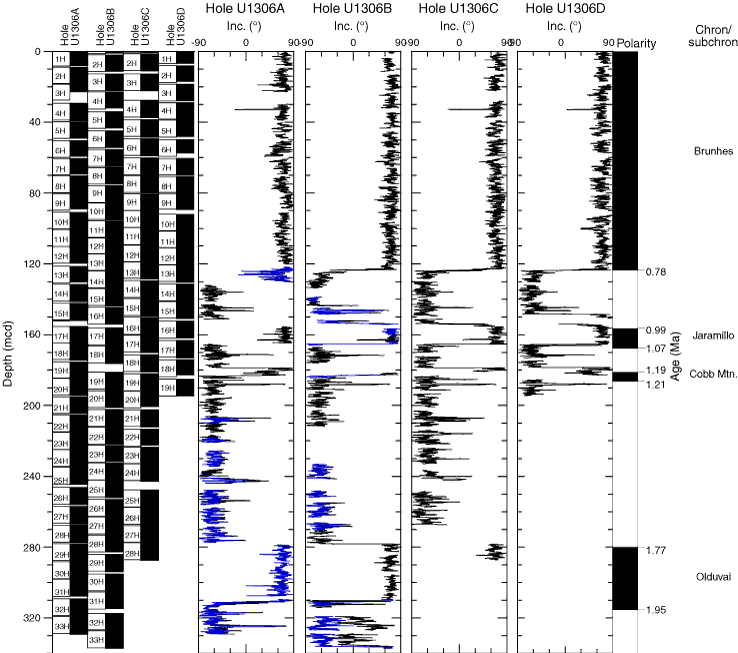
Figure F20. Site U1306 inclination of remanent magnetization after AF demagnetization versus depth. Black and blue curves indicate results obtained after demagnetization at AF peak fields of 10 and 20 mT, respectively. Core recovery is shown in the left panel.

Previous | Close | Next | Top of page