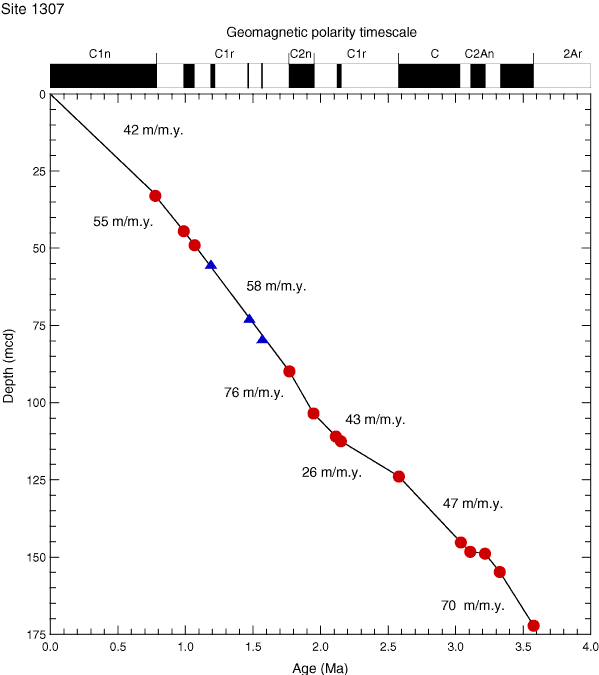
Figure F17. Age-depth curve for Site U1307 derived from the magnetic stratigraphy shown in Figures F15 and F16. Average sedimentation rates in meters per million years are also plotted using the geomagnetic polarity timescale of Cande and Kent (1995) with ages for the Reunion Subchronozone from Channell et al. (2003). Red squares mark polarity boundary interpretations (Table T13), and blue triangles denote the position of the upper Cobb Mountain transition and the Gilsa and Gardar magnetic excursions (Figs. F15, F16) with ages from Channell et al. (2002).

Previous | Close | Next | Top of page