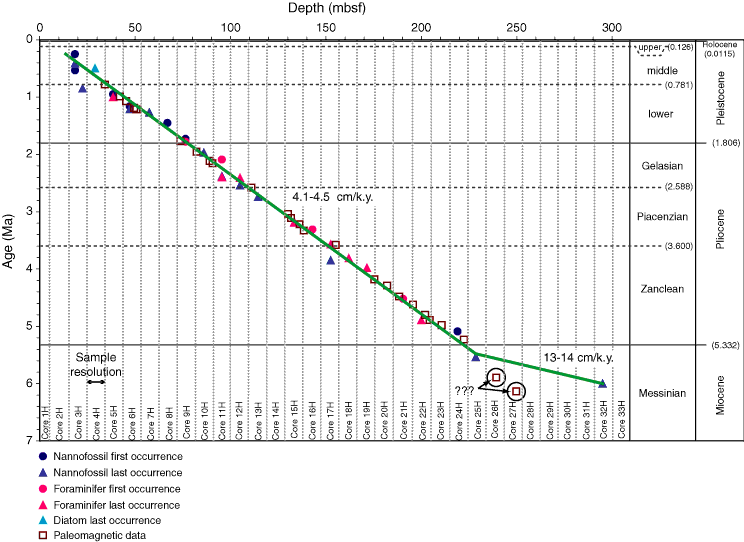
Figure F14. Time vs. depth plot and average sedimentation rates for different intervals of time in Hole U1313A. Biostratigraphic horizons used to construct the curve are given in Table T4. Paleomagnetism data for the curve are given in Table T24.

Previous | Close | Next | Top of page