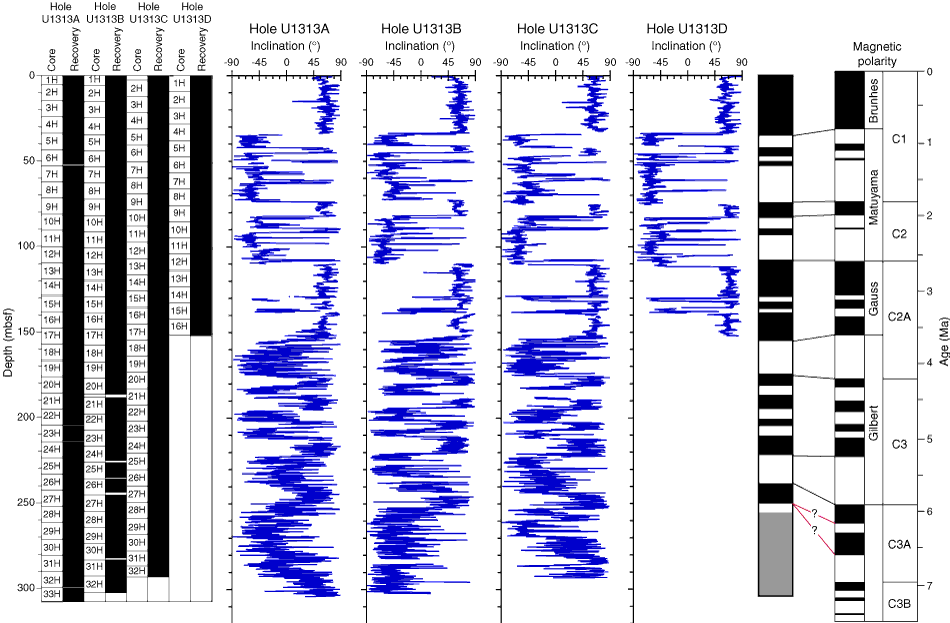
Figure F20. Inclination after 20 mT AF demagnetization vs. depth. Paleomagnetic polarity interpretation (black = normal polarity, white = reversed polarity, gray = undetermined polarity) is displayed on the right side of the figure along with the reference geomagnetic polarity timescale (Cande and Kent, 1995). The red lines indicate two possible ties to the geomagnetic polarity timescale for the deepest interval of normal polarity.
Previous | Close | Next | Top of page