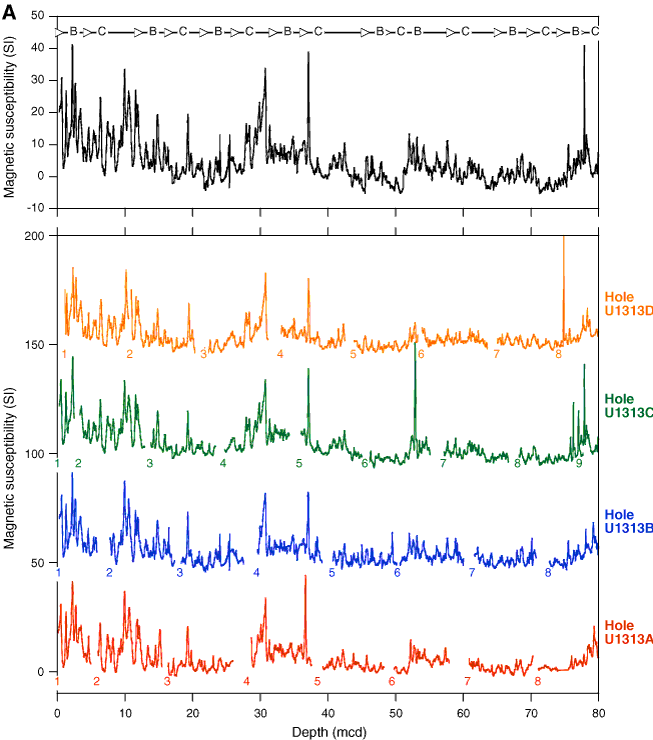
Figure F22. Magnetic susceptibility vs. depth for Holes U1313A–U1313D. Upper panels show composite magnetic susceptibility record indicating which hole was used to form the primary sampling splice. Numbers in lower panels indicate cores. A. 0–80 mcd. (Continued on next page.)

Previous | Close | Next | Top of page