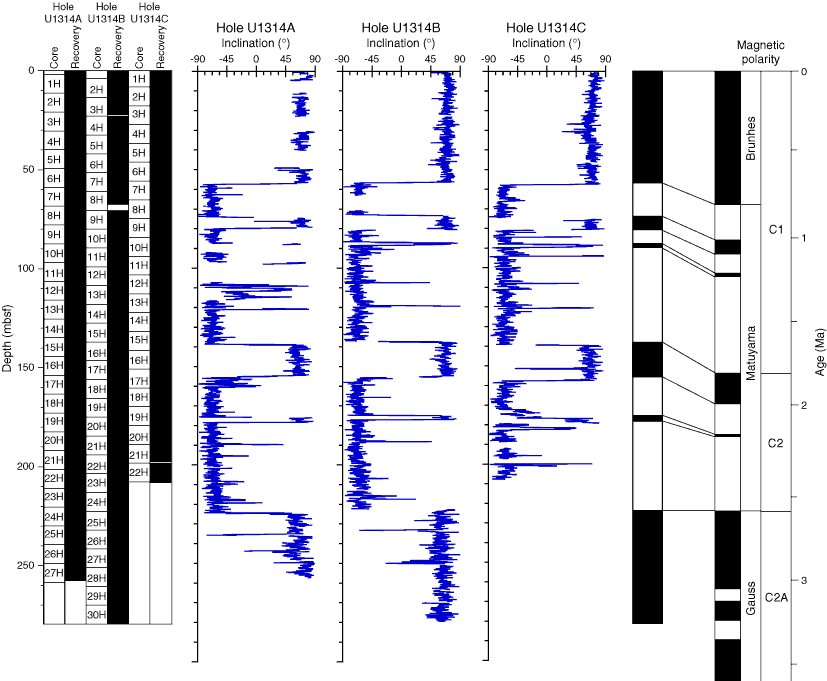
Figure F20. Inclination after 20 mT AF demagnetization. The paleomagnetic polarity interpretation (black = normal polarity, white = reversed polarity) is displayed on the right side of the figure along with the reference geomagnetic polarity timescale (Cande and Kent, 1995).
Previous | Close | Next | Top of page