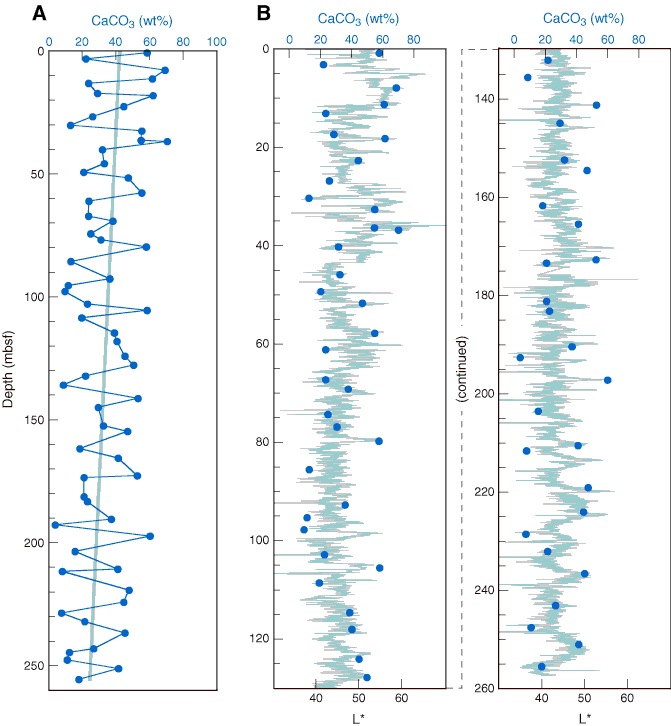
Figure F26. Calcium carbonate content for Hole U1314A. A. Gray line indicates the general trend from lower mean CaCO3 abundance at the bottom toward a higher average at the top. B. CaCO3 (blue dots) compared to color reflectance (L*; gray line).

Previous | Close | Next | Top of page