Previous | Close | Next
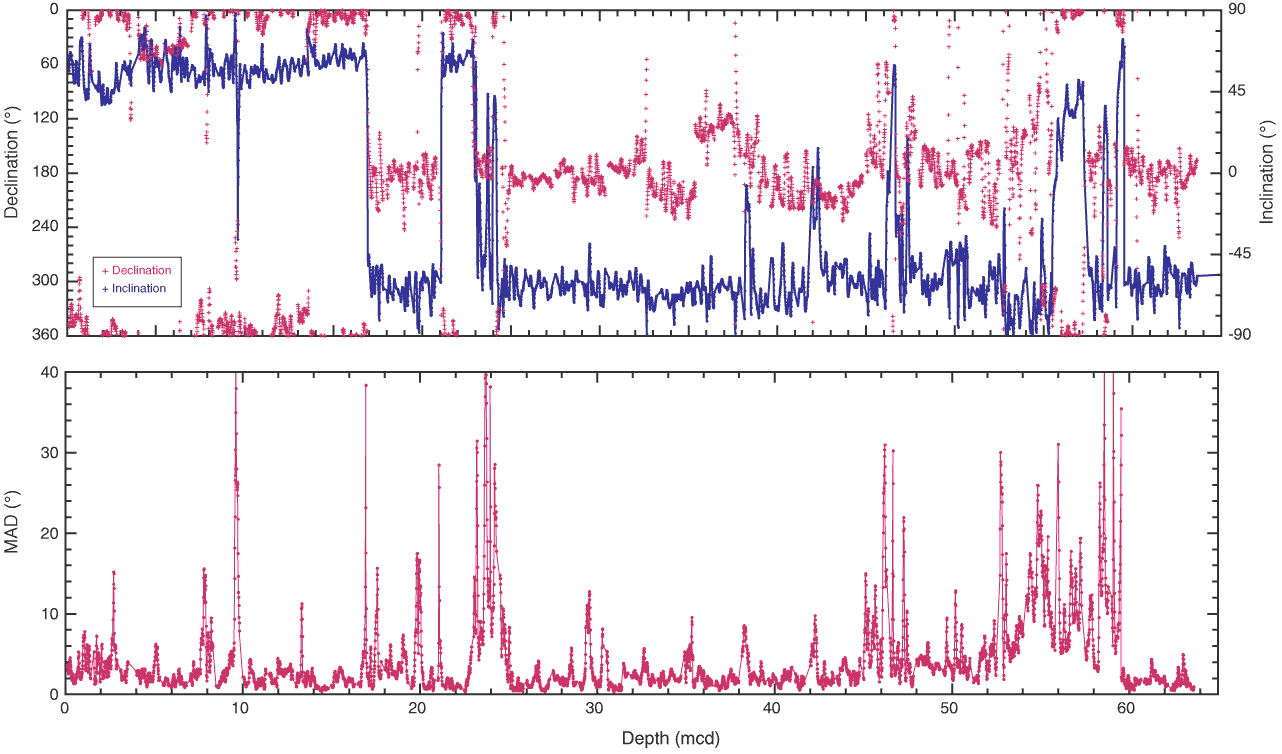
Figure F4. Inclination values plotted against depth, Site U1312. Data obtained after principal component analysis (Kirschvink, 1980) and maximum angular deviation (MAD) values.
Previous | Close | Next | Top of page