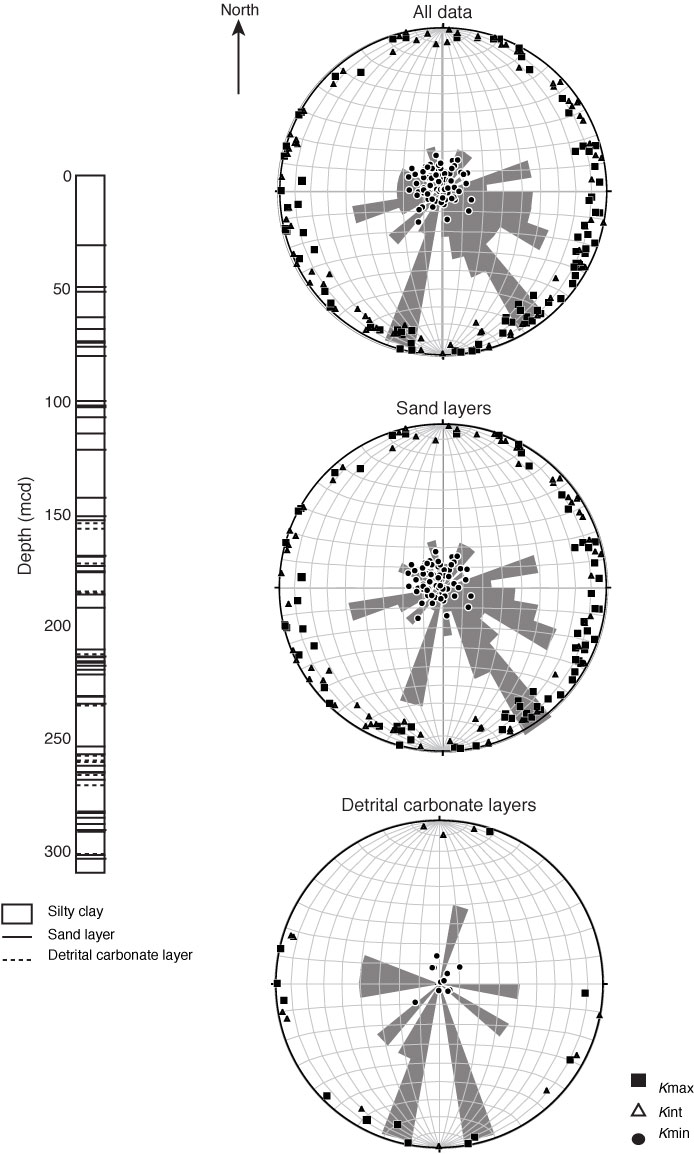
Figure F4. Graphic representations of anisotropy of magnetic susceptibility data, Site U1305. The stratigraphic column on the left shows the distributions of different lithological units. The three stereoplots (lower hemisphere) to the right show the directions of the principal axes of magnetic ellipsoids (Kmax > Kint > Kmin) in each layer. Rose diagrams in the centers of the stereoplots represent the orientations of Kmax in 10° each. mcd = meters composite depth.
Previous | Close | Top of page