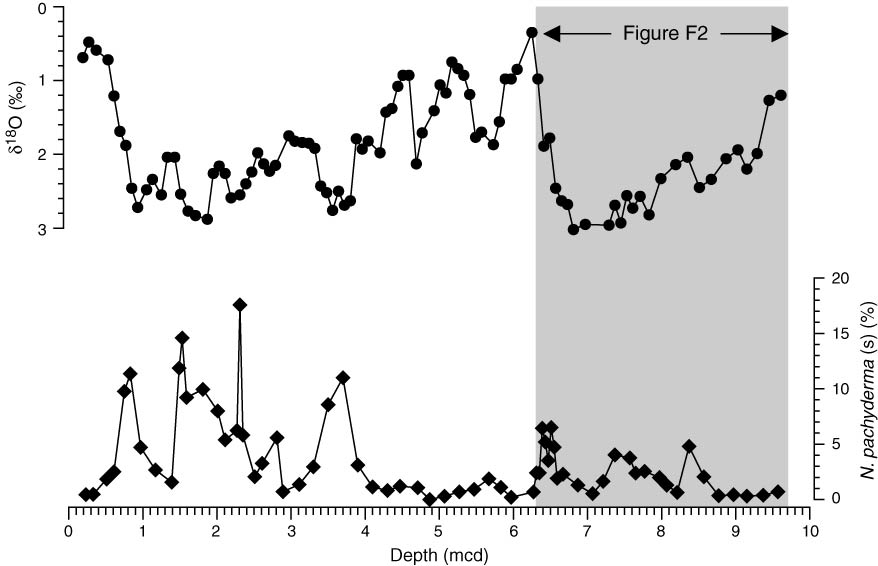
Figure F1. Globigerina bulloides oxygen isotopes (δ18O) and relative abundance of Neogloboquadrina pachyderma (sinistral) versus depth, Site U1313. Shaded area between 6.3 and 9.7 mcd represents MISs 5e and 6 interval in which high-resolution data are plotted in Figure F2.
Close | Next | Top of page