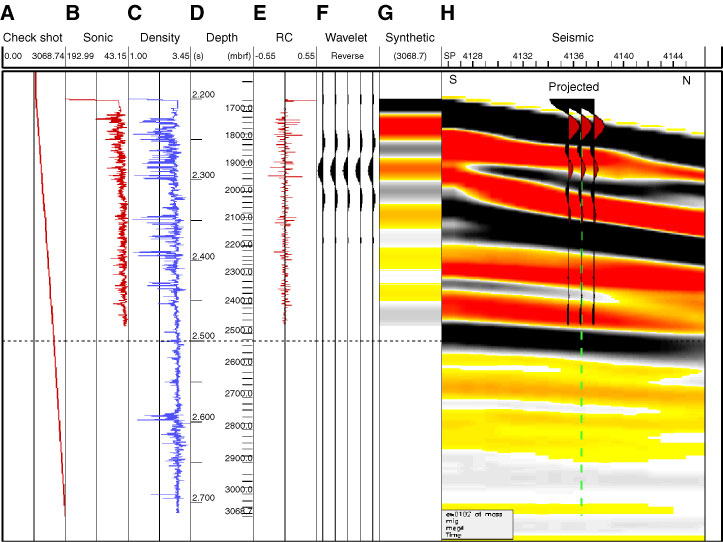
Figure F25. Synthetic seismogram model derived from Hole U1309D logging measurements and comparison to a section of MCS reflection Line Meg-4 (Fig. F2). A. Two-way traveltime-to-depth based on VSP check shot data to 750 mbsf and an assumed value at 1415 mbsf. B. Conversion of logging P-wave velocity to traveltime at depth. C. Logging bulk density. D. Time-depth scales. E. Reflectivity model derived from data from B and C with bottom velocity value assumed. RC = reflectivity coefficient, which indicates impedance contrast. F. Wavelet convolved with reflectivity model. G. Resulting synthetic seismogram. H. Synthetic seismogram trace overlain on section of MCS Line Meg-4 at projected location of Hole U1309D. SP = shotpoint.
Previous | Close | Next | Top of page