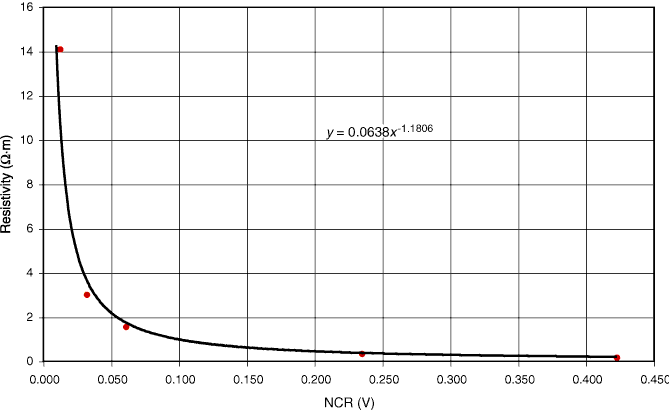
Figure F14. Resistivity of standard solutions of NaCl versus average peak instrument response (red dots) from Figure F13. Black line shows best-fit curve used to convert volts to resistivity. NCR = noncontact resistivity.

Previous | Close | Next | Top of page