Previous | Close | Next
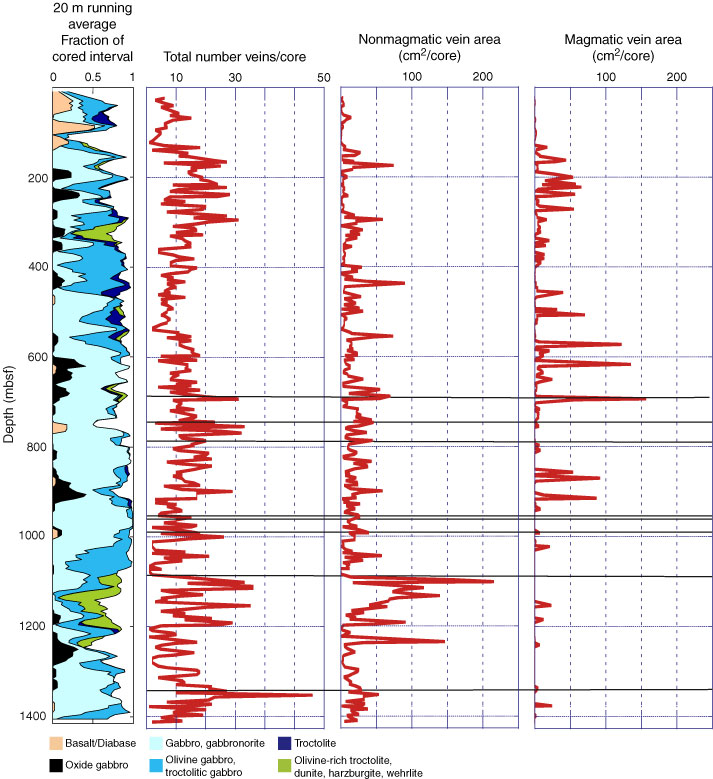
Figure F141. Downhole variation in total number of veins, plotted with running average of lithology. Dark lines are locations of identified fault zones below 400 mbsf.
Previous | Close | Next | Top of page