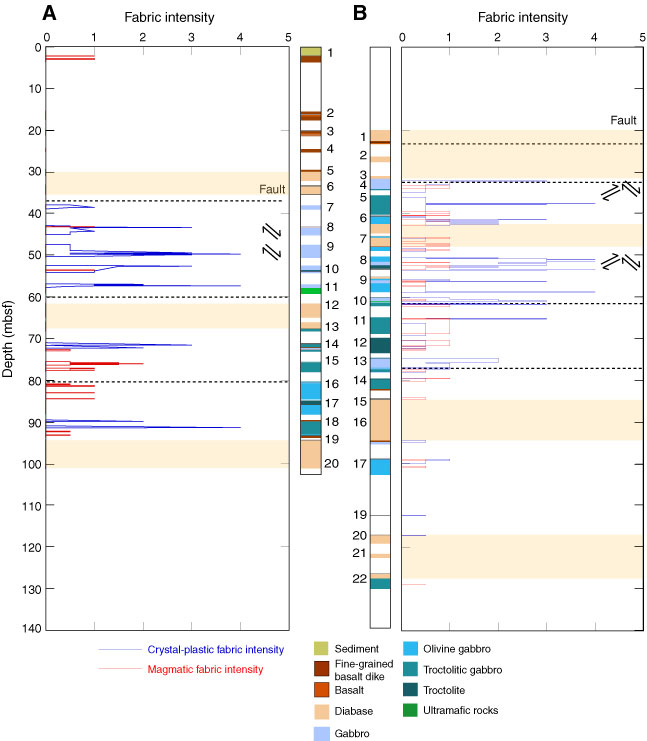
Figure F159. Downhole plots showing the intensities of crystal-plastic and magmatic deformation in (A) Hole U1309B and (B) Hole U1309D to 132 mbsf. Dotted lines indicate where faults are inferred based on cataclastic fabrics. Arrows = sense of shear where the kinematics of deformation could be determined, tan bands = intervals dominated by diabase, numbers = igneous units.
Previous | Close | Next | Top of page