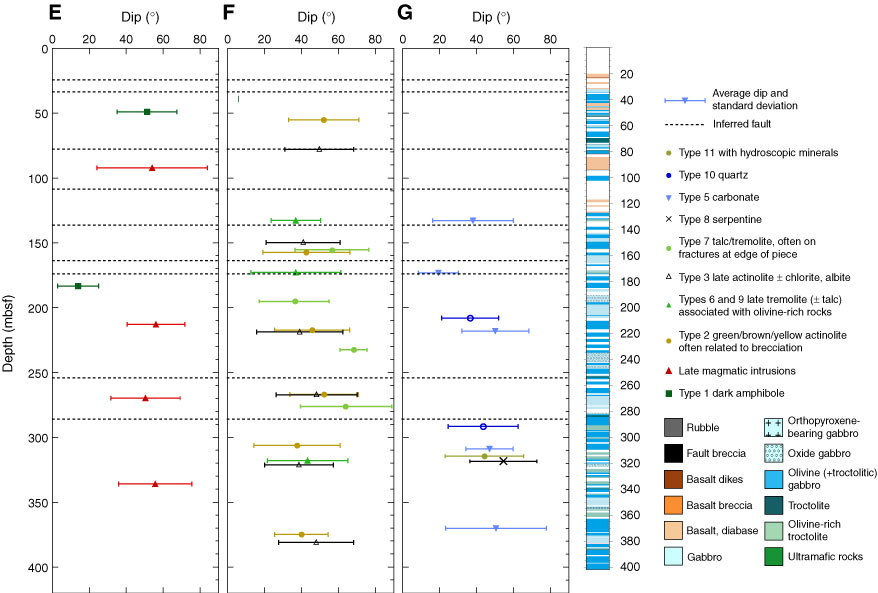
Figure F172 (continued). E–G. Downhole plots of vein dips averaged over structural intervals in Hole U1309D (Expedition 304). Data from A–D were used to calculate an average dip and the standard deviation for points within a defined structural interval. Average dips were then plotted at the average depth for the population of points used for each calculation. Standard deviation shown by bars.
Previous | Close | Next | Top of page