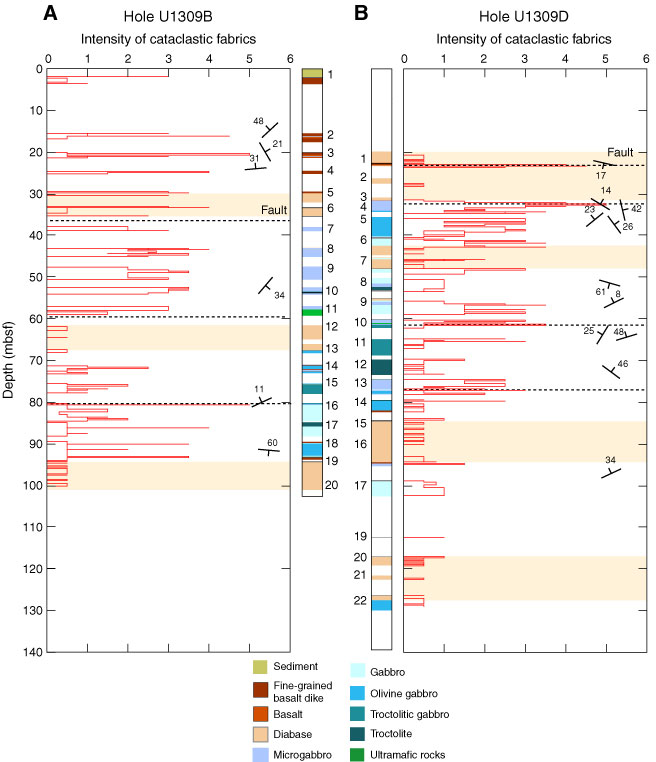
Figure F194. Absolute intensity of cataclastic fabrics in Holes (A) U1309B and (B) U1309D to 132 mbsf plotted with orientation data (north strike is vertical for strike/dip symbols) of intense cataclastic zones. Diabase is highlighted (beige) across the figures to depict the decrease in intensity in those intervals. Dotted lines = locations of faults inferred based on cataclastic fabrics.
Previous | Close | Next | Top of page