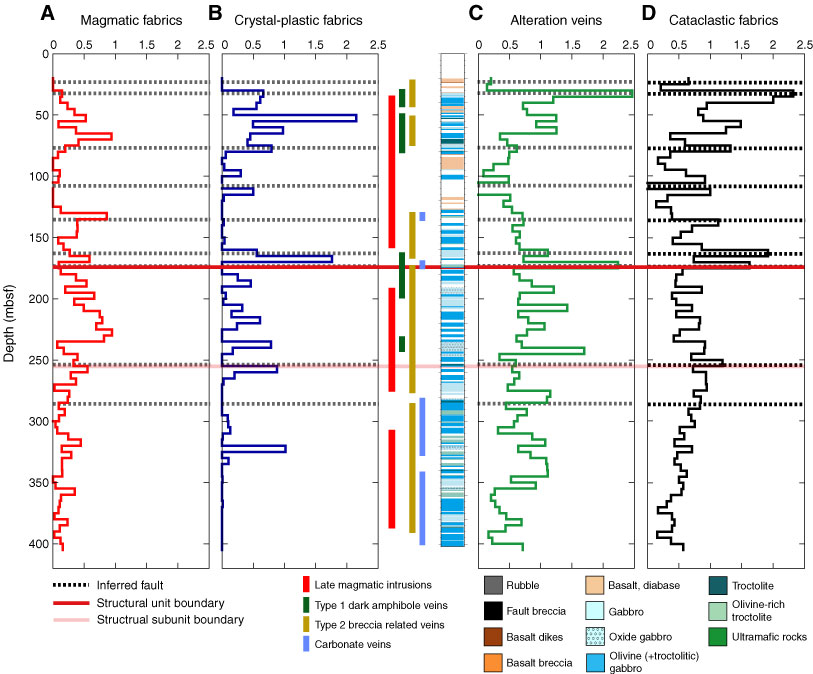
Figure F209. Downhole plots showing 5 m averaged intensities in Hole U1309D to 400 mbsf (Expedition 304). A. Magmatic fabrics. B. Crystal-plastic fabrics. C. Alteration veins. D. Cataclastic fabrics. Distribution of selected vein types is shown by solid bars adjacent to the lithologic column. Structural unit boundary (and subboundary) is indicated by solid red (and pink) line.
Previous | Close | Next | Top of page