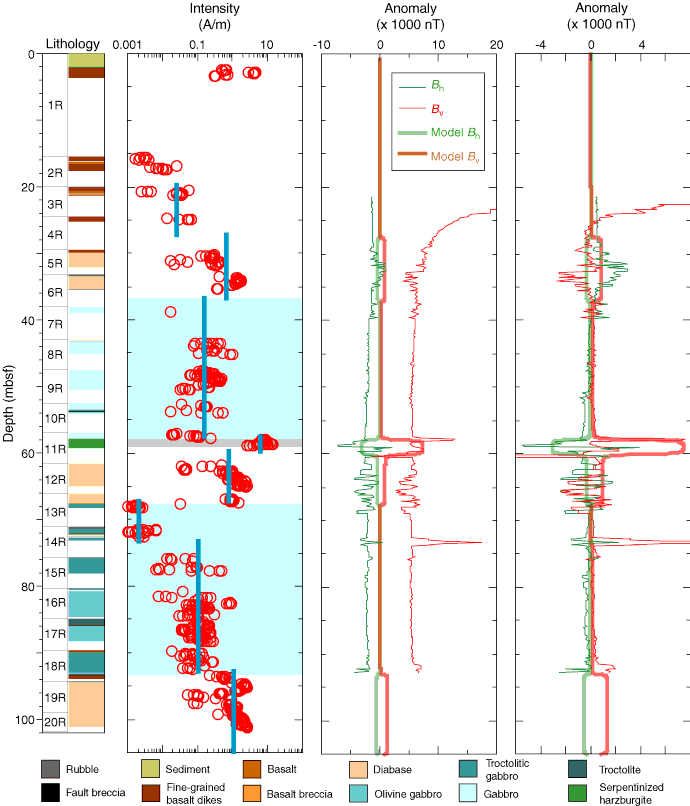
Figure F250. Comparison of sample magnetizations from recovered core and magnetic anomaly data acquired during logging. Remanence intensity from the archive halves is after 10 mT demagnetization. Average intensities used for modeling of the borehole magnetic field are shown by the heavy blue lines. Column 3 shows uncorrected horizontal (Bh) and vertical (Bv) magnetic anomaly profiles from run 1 of the GPIT tool. Magnetic anomalies calculated by subtracting the IGRF field values at the site (declination = –15.7°, inclination = 47.8°, intensity = 40,918 nT). Forward modeling results (heavier lines) based on the observed magnetization values from the core suggest large offsets of the fluxgate sensors. Column 4 shows anomaly profiles after removal of offsets of –1850 nT and +5150 nT from the horizontal and vertical anomaly components, respectively. An exponential fit to the magnetic anomaly from the drill pipe has also been removed from the vertical component.

Previous | Close | Next | Top of page