Previous | Close | Next
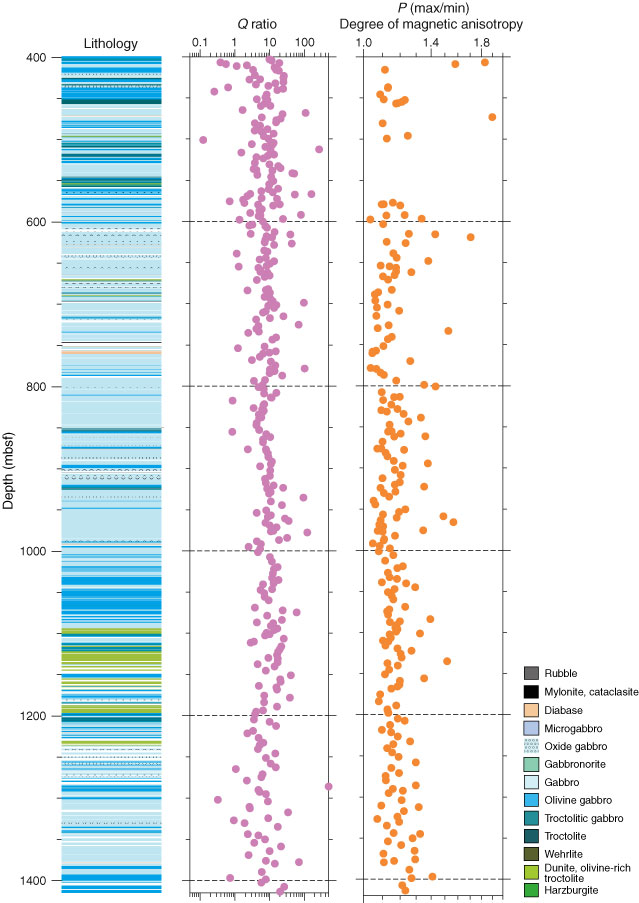
Figure F255. Downhole plot of (A) Königsberger ratios (Q) and (B) degree of anisotropy (from AMS) of rock samples from Hole U1309D below 400 mbsf (Expedition 305).
Previous | Close | Next | Top of page