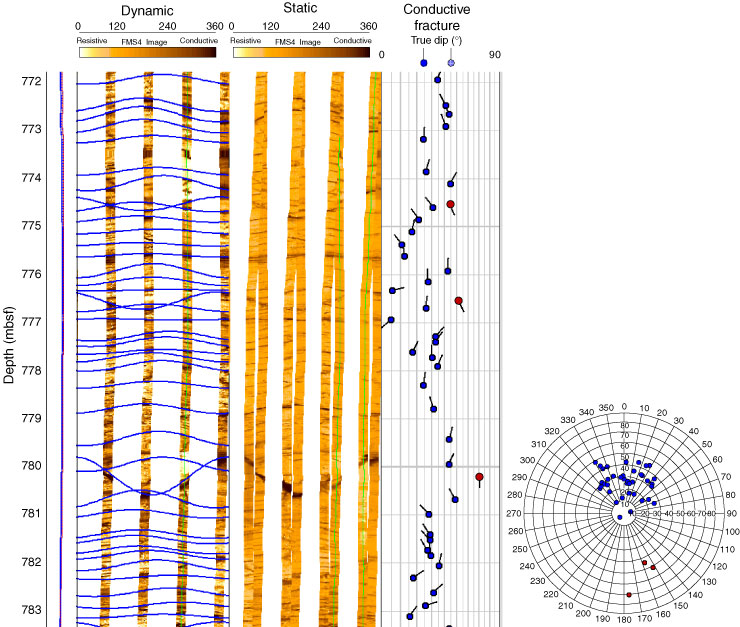
Figure F294. Detailed Formation MicroScanner (FMS) and UBI images displaying a fractured interval (772–783 mbsf) in Hole U1309D. Rose plot indicates that the conductive features are consistent in direction, with the shallow structures dipping toward north and the steep features dipping south.
Previous | Close | Next | Top of page