Previous | Close | Next
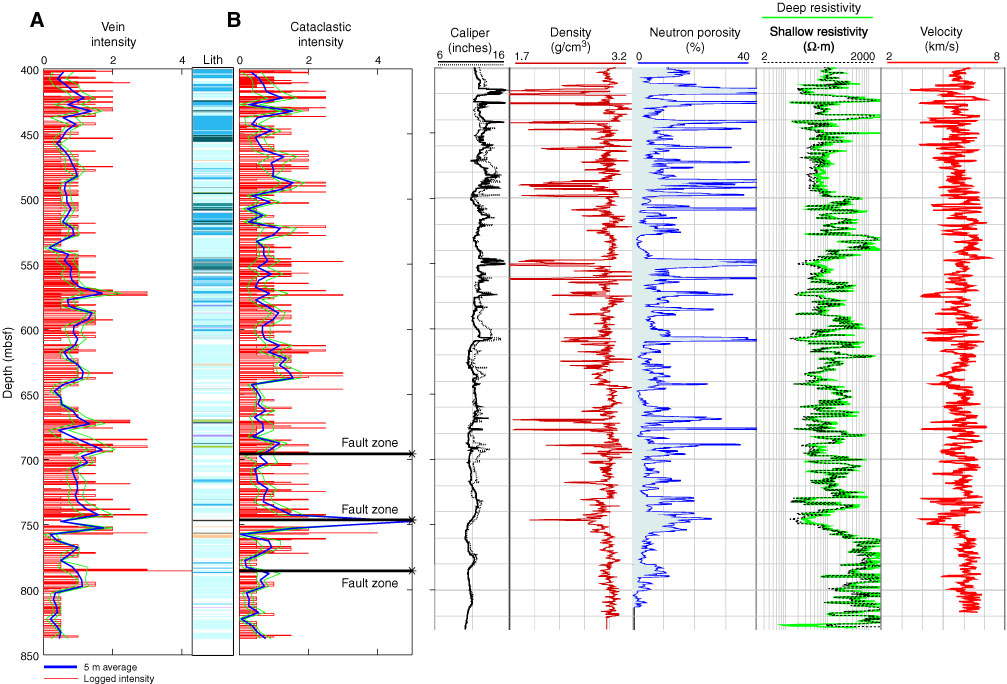
Figure F296. Comparison of logging data with vein and cataclastic intensity (600–836 mbsf) (see “Structural geology”).
Previous | Close | Next | Top of page